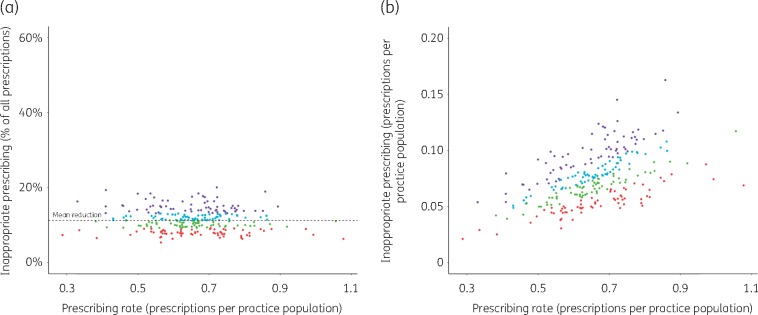
Figure 3.
Prescribing rates of English practices versus their inappropriate prescribing [based on guidelines and expert opinion (medians) only]. (a) Inappropriate prescribing as a percentage of the totality of a practice’s prescriptions. (b) Inappropriate prescriptions per practice population (mid-year). Dot colours: purple, practices in the highest inappropriate prescribing quartile; cyan, practices between median and third quartile; green, practices between first quartile and median; red, lowest quartile.

