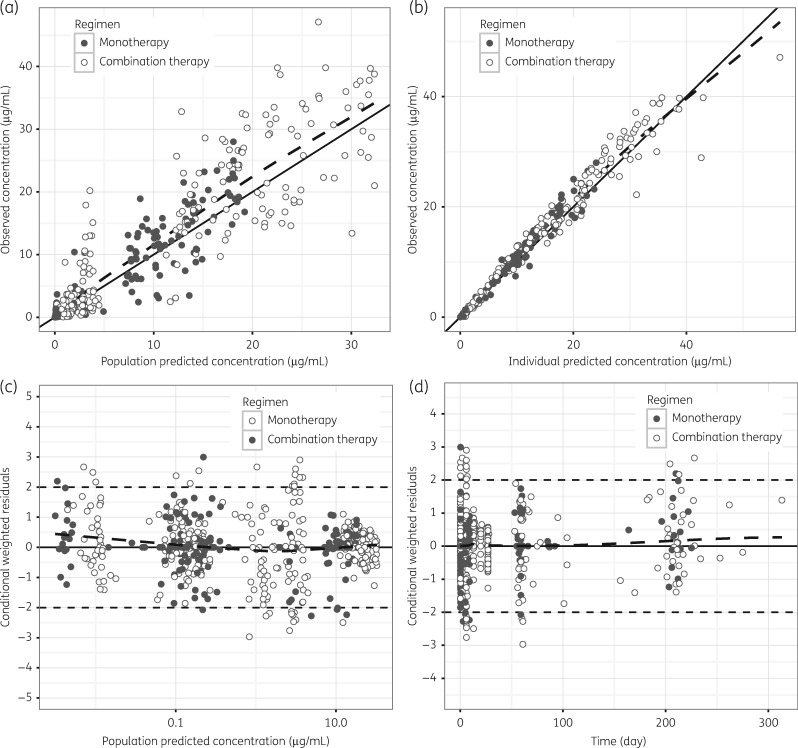
Figure 1.
Goodness-of-fit plots for the final miltefosine population pharmacokinetic model. Observed concentrations versus (a) population predicted concentrations and (b) individual predicted concentrations. Conditional weighted residuals versus (c) population predicted concentrations and (d) time. Solid line represents the line of identity or unity and the broken line is the locally weighted least square regression line to indicate trends.

