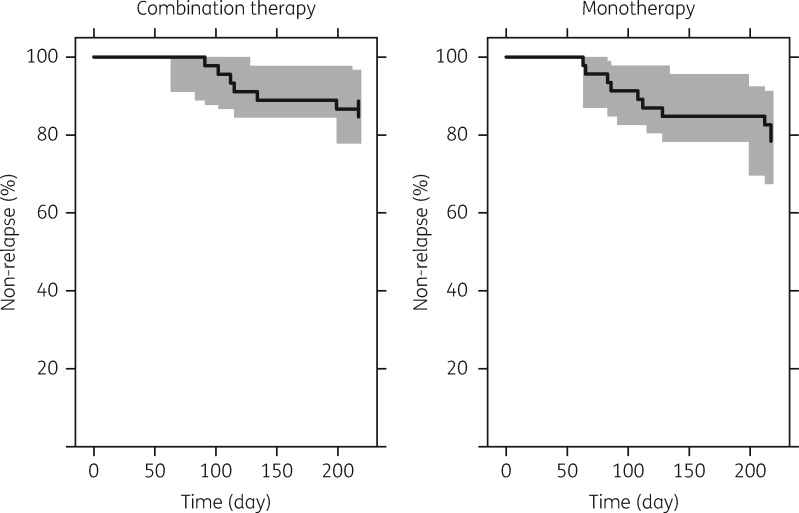
Figure 3.
Visual predictive check of the final time-to-event model with an inhibitory effect of miltefosine exposure (Time > EC90) on the hazard function. Left plot depicts the combination therapy regimen (10 days of miltefosine), the right plot the monotherapy arm (28 days of miltefosine). Solid black line is the Kaplan–Meier plot of the observed relapses of visceral leishmaniasis during the follow-up period, and the grey area is the 95% prediction interval of the simulated time to the relapse of disease (n = 1000 simulations).

