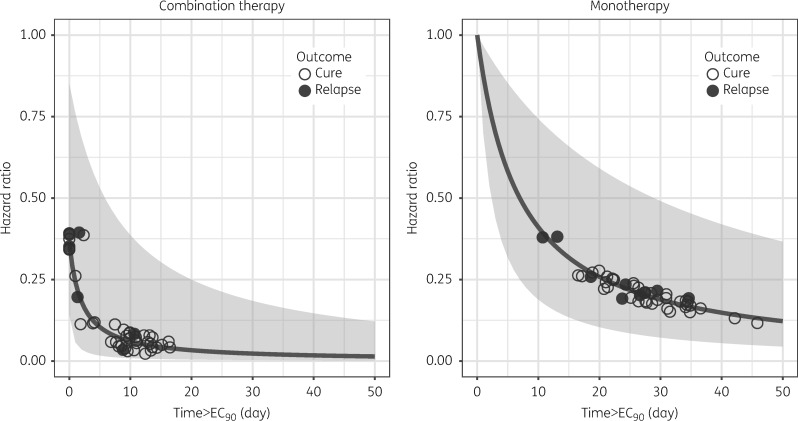
Figure 4.
Hazard ratio versus the duration of miltefosine concentration >EC90 (Time > EC90). Lines indicate the estimated hazard ratios for the combination therapy (left panel) and miltefosine monotherapy (right panel). Grey areas represent the respective computed 90% CI. Circles represent the observed individuals: open circles represent cured patients, while filled circles represent patients who relapsed and received rescue treatment.

