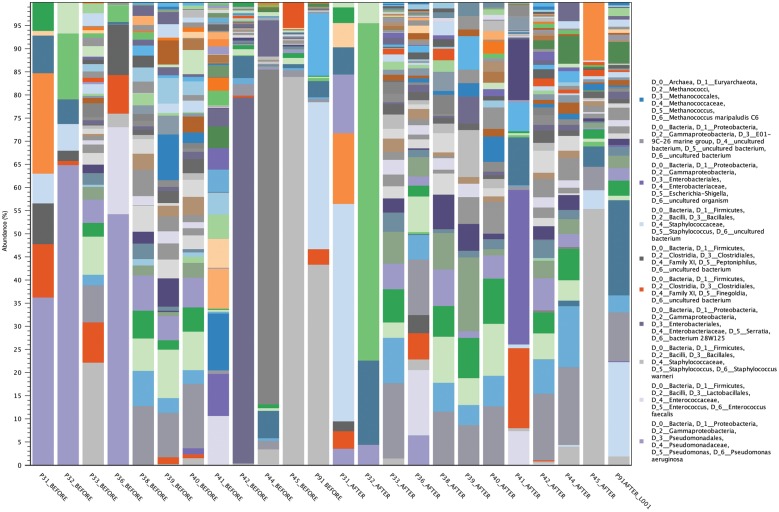
Figure 3.
Most frequent microorganisms based on the pooling of all DNA sequences and the total number of DNA sequences attributed to each microorganism. This graph also exemplifies the contrast between low- and high-frequency taxa at the genus/species level. High-frequency taxa consist of a few predominant microorganisms (typically between 1 and 9 microorganisms; samples 31, 32, 36, 42, 44, 45 and 91) and low-frequency taxa consist of multiple microorganisms (typically 10-fold in comparison with high-frequency taxa; >30–90 microorganisms; samples 33, 38, 39, 40 and 41).

