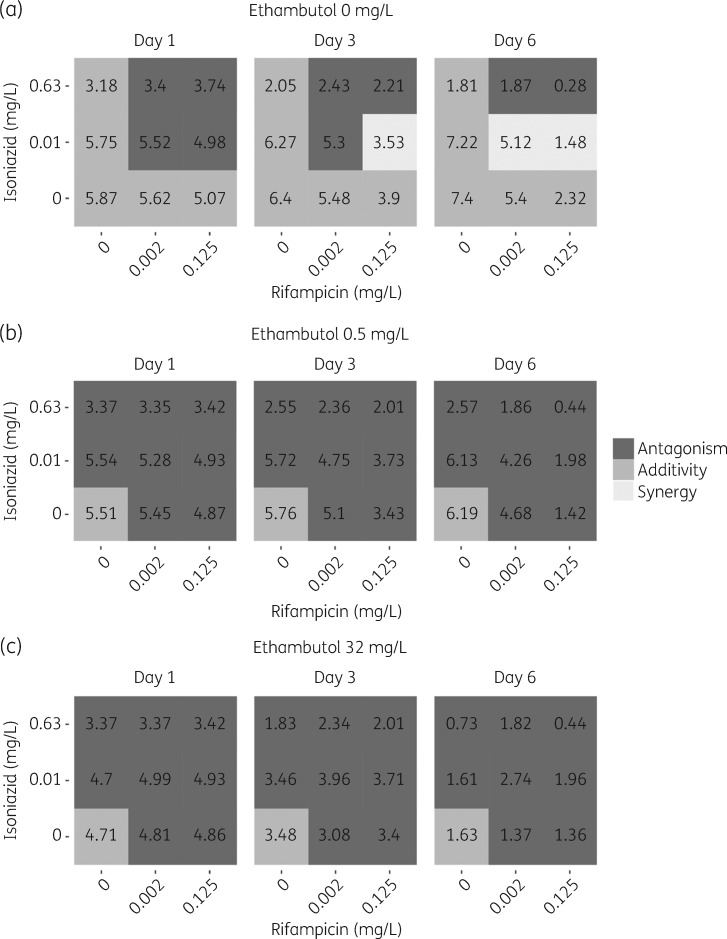
Figure 4.
PD interaction classification on biomarker level, cfu, for combinations of (a) rifampicin and isoniazid, (b) rifampicin, isoniazid and ethambutol (0.5 mg/L) and (c) rifampicin, isoniazid and ethambutol (32 mg/L). The classification was based on predictions from the final combined MTP and GPDI model and a model assuming only additive drug effect (i.e. only MTP model). Dark grey indicates less effect than expected additivity (antagonism), grey indicates additivity and light grey indicates more effect than expected additivity (synergy). The numbers correspond to the log10 cfu at days 1, 3 and 6.

