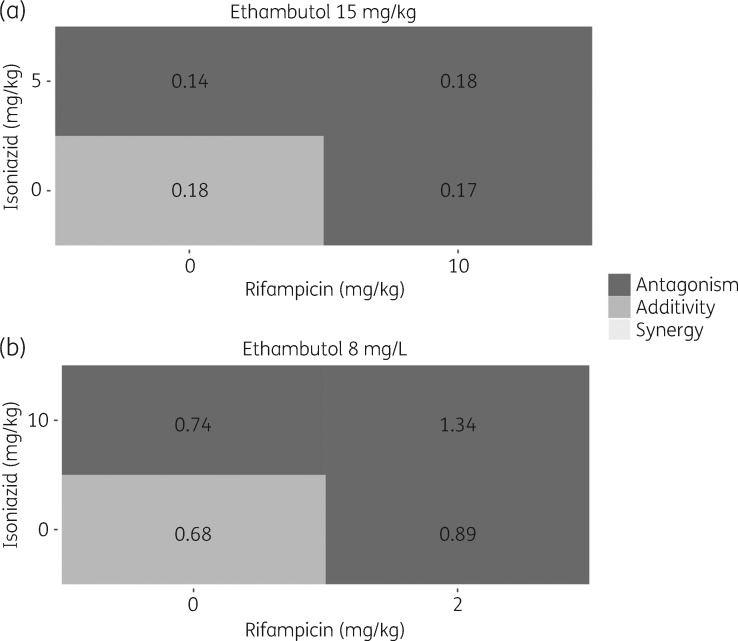
Figure 5.
Biomarker level (cfu) PD interactions, classified as deviation from expected additivity, between isoniazid, rifampicin and ethambutol in (a) observed clinical EBA 0–14 days data and (b) predicted from in vitro using the MTP-GPDI modelling approach using clinically relevant concentrations [i.e. unbound maximal drug concentrations and last studied timepoint (6 days)]. Dark grey indicates less effect than expected additivity (antagonism), grey indicates additivity and light grey indicates more effect than expected additivity (synergy). The numbers correspond to EBA (log10 cfu/mL/day) (a) 0–14 days and (b) 0–6 days.

