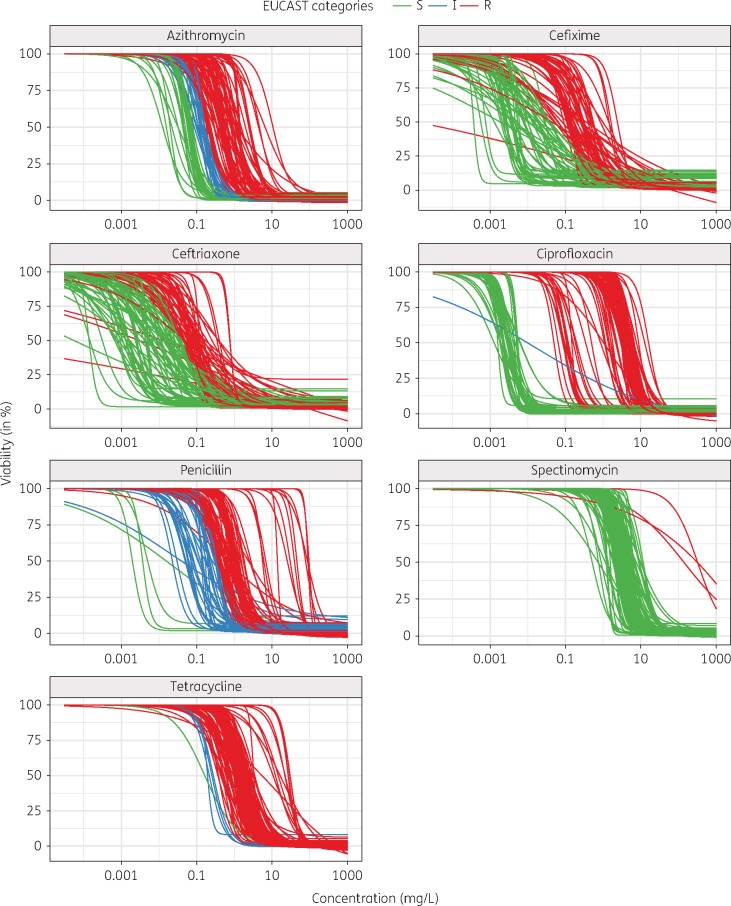
Figure 1.
Potency shift of antimicrobials across different strains of N. gonorrhoeae. Dose–response curves for all strains and antimicrobials are shown (except samples above the limit of detection). Strains that were classified as susceptible according to EUCAST 2016 MIC breakpoints46 are coloured green, intermediate strains blue and resistant strains red. The gradual shift of the potencies (EC50) towards higher concentrations can be observed for all antimicrobials.

