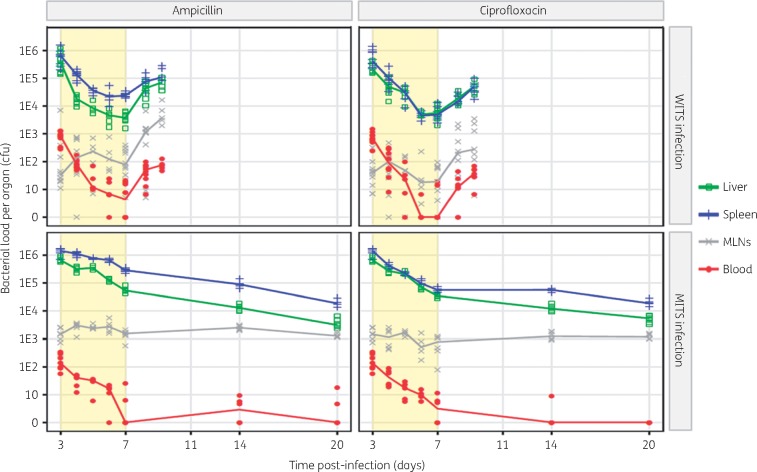
Figure 1.
Bacterial loads in different organs at various timepoints post-infection. Different groups of C57BL/6 mice were infected iv with equal mixes of eight WITS to a total dose of ∼1000 cfu, or eight MITS for a total dose of ∼5 × 10⁵ cfu. Each symbol represents total cfu count from an organ of a single mouse. Solid lines join the median of cfu values for each organ. Light yellow background indicates the phase of antimicrobial treatment (ip for 4 days every 12 h). This figure appears in colour in the online version of JAC and in black and white in the printed version of JAC.

