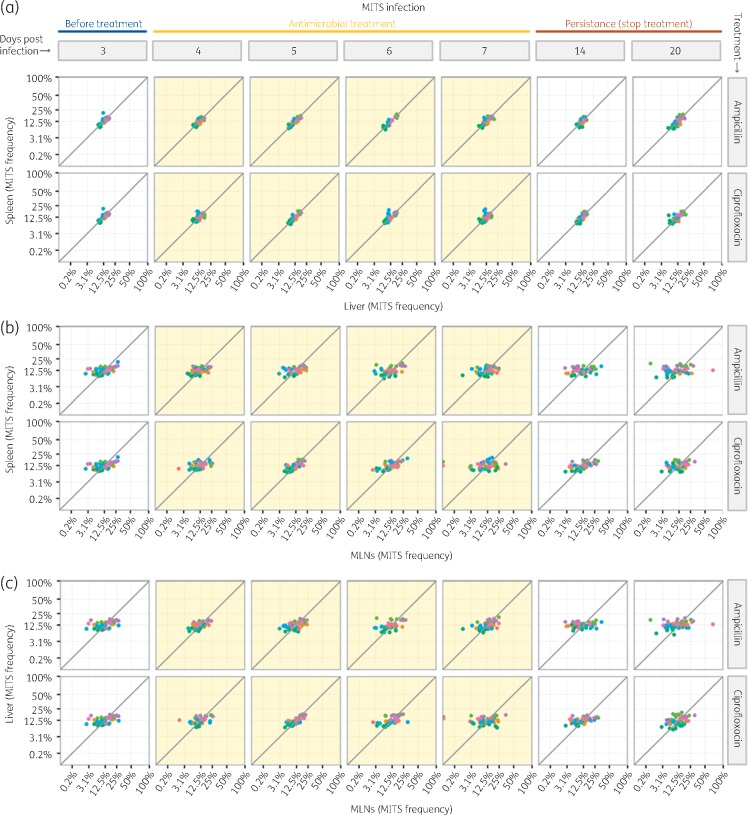
Figure 3.
Pairwise distribution of the eight MITS in different organs for each mouse: (a) spleen versus liver; (b) spleen versus MLNs; and (c) liver versus MLNs. Each dot shows the frequency of a single MITS coded by colour. Each panel shows data from all the mice treated with a given antimicrobial and euthanized on a given day. Light yellow background indicates the time of antimicrobial treatment. This figure appears in colour in the online version of JAC and in black and white in the printed version of JAC.

