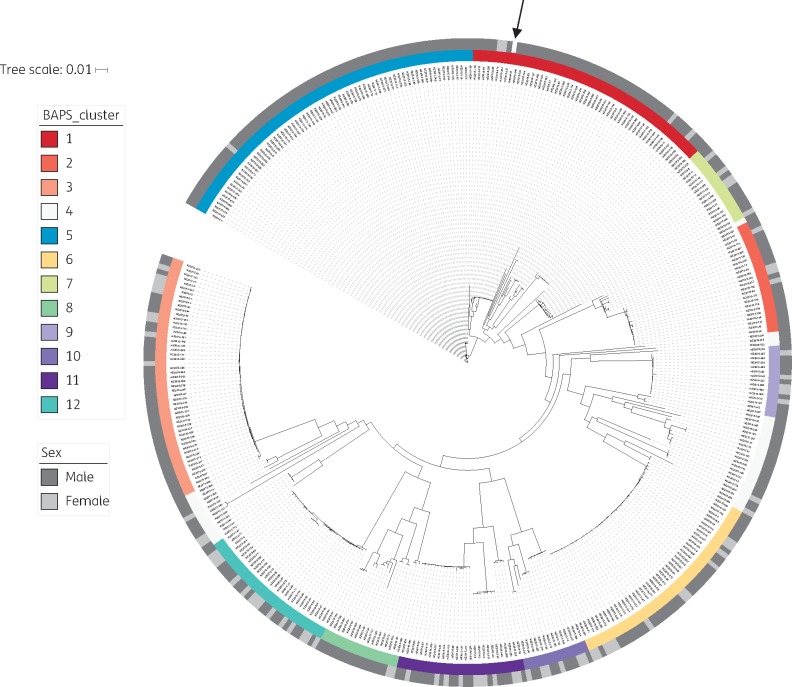
Figure 1.
Population structure of Neisseria gonorrhoeae in New Zealand, 2014–15. High-quality WGS data were obtained for 398 of 400 New Zealand isolates (99.5%). Genome coverage to the NCCP11945 reference was 97% (SD 1.1%), with median depth of coverage of 96× (IQR 87–108). Recombination was identified and masked using Gubbins.15 A subsequent phylogenetic tree was built based on 4529 total core SNP positions (with 3291 informative sites) using the maximum likelihood method via IQ-TREE.17 A General Time Reversible model of nucleotide substitution with four gamma categories was selected based on the lowest Bayesian Information Criterion, with an ascertainment bias correction to account for only SNP sites included in the input. Ten-thousand ultra-fast bootstrap replicates were performed to assess uncertainty in tree topology; for clarity, these are shown in Figure S3. Bayesian Analysis of Population Structure (BAPS) was used to identify clusters; only the first level of clustering is shown. Note that in BAPS-4 the most divergent isolates are grouped together; this does not represent a biologically meaningful cluster. The sex of the patients is also shown. The reference genome is indicated with an arrow.

