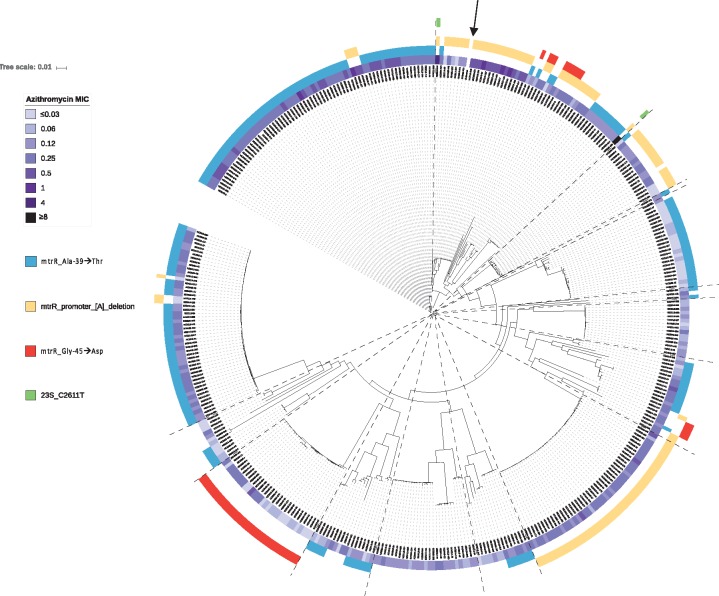
Figure 4.
Mechanisms of azithromycin resistance in New Zealand. Maximum likelihood tree of all 398 New Zealand isolates, after adjusting for recombination with Gubbins.15 Azithromycin MICs in mg/L are shown, along with corresponding mutations known to be associated with phenotypic resistance. The BAPS groups identified (as shown in Figure 1) have been overlaid using dashed lines. The reference genome is indicated with an arrow.

