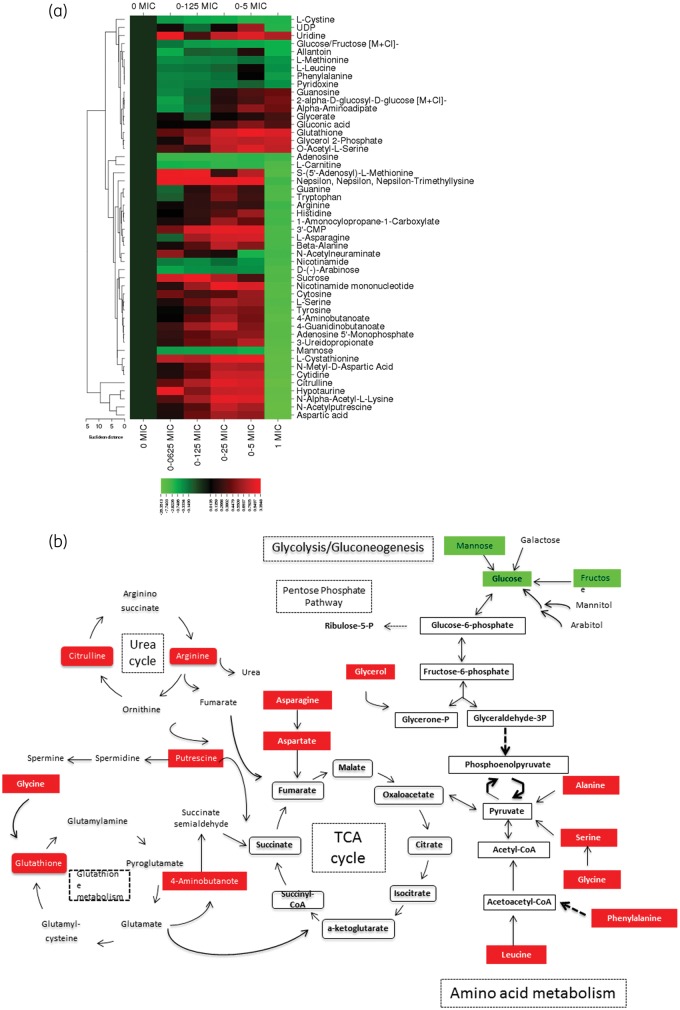
Figure 1.
(a) Heat map of altered metabolites in C. albicans in response to increasing micafungin concentrations. The heat map shows the 50 metabolites whose abundance was significantly altered in response to increasing micafungin concentrations from 0 mg/L (0 × MIC for this strain) to 0.25 mg/L (1 × MIC for this strain). Changes in abundance of each metabolite are indicated by colour coding, with red indicative of an increase in intracellular abundance and green indicative of a decrease relative to the baseline (as defined by the abundance in untreated C. albicans). Normalized levels for each metabolite across replicates from independent experiments were generated by dividing the adjusted abundance for each by the average adjusted abundance. A heat map was created using CIMminer software after log(2) transformation of the average normalized abundance of each metabolite (average of replicates across independent experiments). The metabolites that are depicted in the heat map are those with an adjusted P value ≤0.5 after correction for multiple hypothesis testing (Benjamini–Hochberg correction). (b) Schematic overview of the key molecules of C. albicans metabolism that are affected during treatment with micafungin at subinhibitory concentrations (red indicates increased abundances and green decreased abundances at subinhibitory concentrations of micafungin). Unless otherwise cited, metabolites were ascribed to pathways by comparison against the KEGG (Kyoto Encyclopedia of Genes and Genomes) Database. This figure appears in colour in the online version of JAC and in black and white in the print version of JAC.

