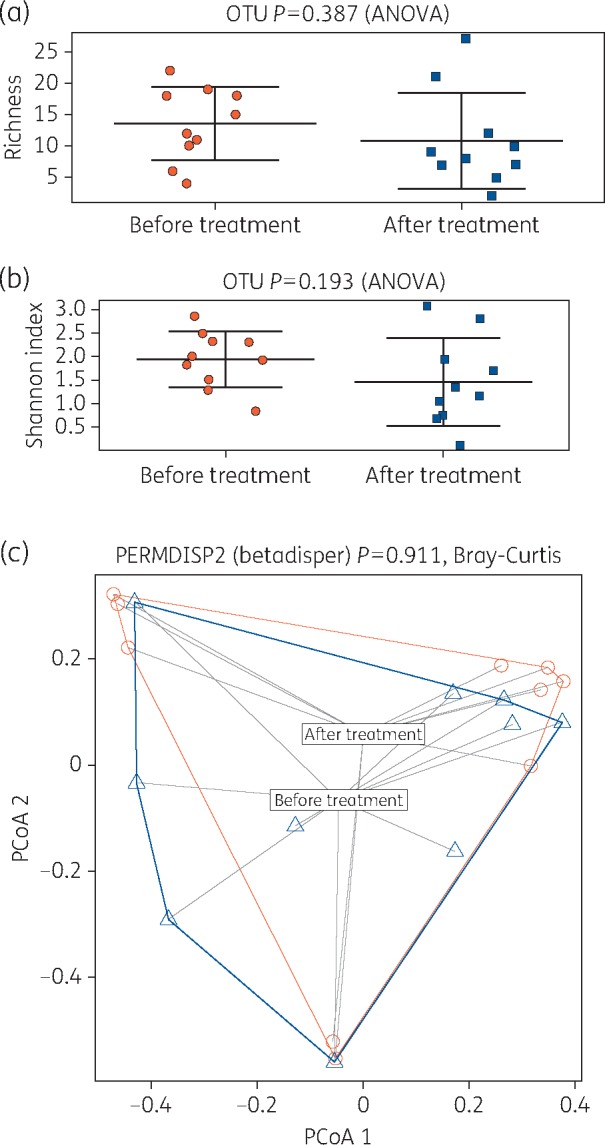
Figure 5.

Alpha and beta diversity analysis pre- and post-treatment with SBMO. (a) The richness plot is a measure of the number of distinct or unique OTUs. These were reduced post-treatment but were non-significant. (b) The Shannon index is a measure of diversity that includes the number of unique microbial taxa and their relative evenness within each sample. Diversity of biofilm in diabetic foot ulcers post-treatment is reduced but non-significantly. (c) Principal coordinates analysis plots with Bray–Curtis distances between pre- and post-treatment samples identified that microbial communities are similar pre- and pre-treatment (blue triangles, pre-treatment; red circles, post-treatment). This figure appears in colour in the online version of JAC and in black and white in the print version of JAC.
