FIGURE 2.
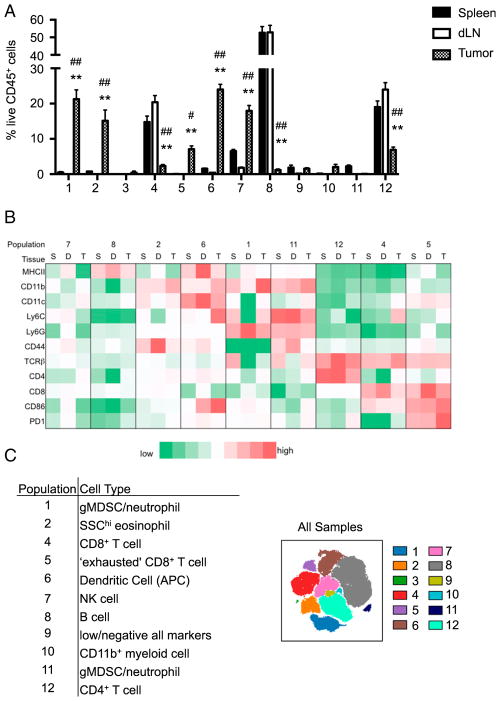
Identification of viSNE-defined populations. viSNE analysis of murine immune cells in spleens, dLN, and MB49 tumors run on 6000 live CD45+ single cells from each sample. (A) Relative proportions of immune cell populations defined in Fig. 1B isolated from the tumor, spleen, and dLN. **p < 0.0001 when comparing spleen and tumor, #p = 0.001, ##p < 0.0001 when comparing dLN and tumor. The p values were derived by two-way ANOVA. (B) MFI of surface markers for each immune cell population isolated from the spleen (S), dLN (D), and tumor (T). (C) Predicted cell types based on surface marker expression and the frequency of cell populations among tissues.

