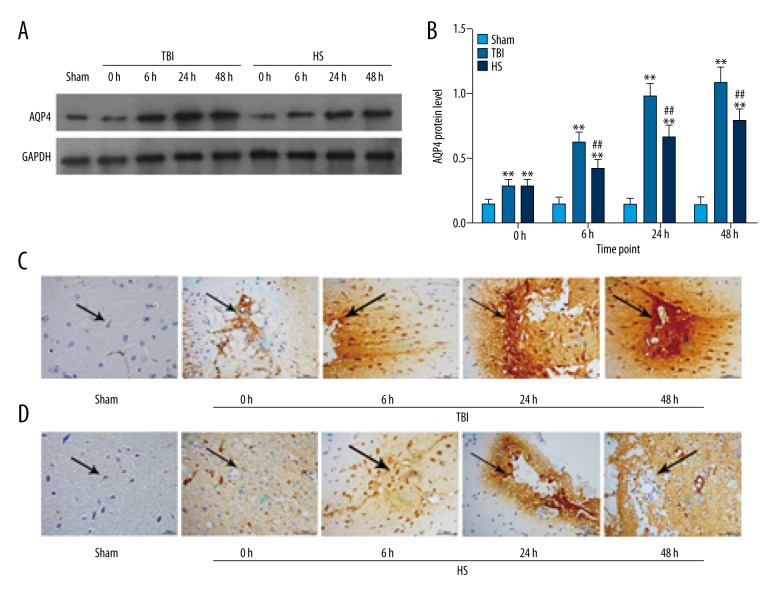
Figure 2.
AQP4 expression and distribution in brain tissue following TBI and HS treatment. (A) AQP4 levels at 0, 6, 24, and 48 h in the TBI and HS groups. (B) Quantitative analysis of protein expression. * P<0.05, ** P<0.01 vs. sham group; # P<0.05, ## P<0.01 vs. TBI group. (C, D) AQP4 distribution in the brain tissues of the TBI, HS, and sham groups as detected by immunohistochemistry at 0, 6, 24, and 48 h. Scale bar: 50 μm.

