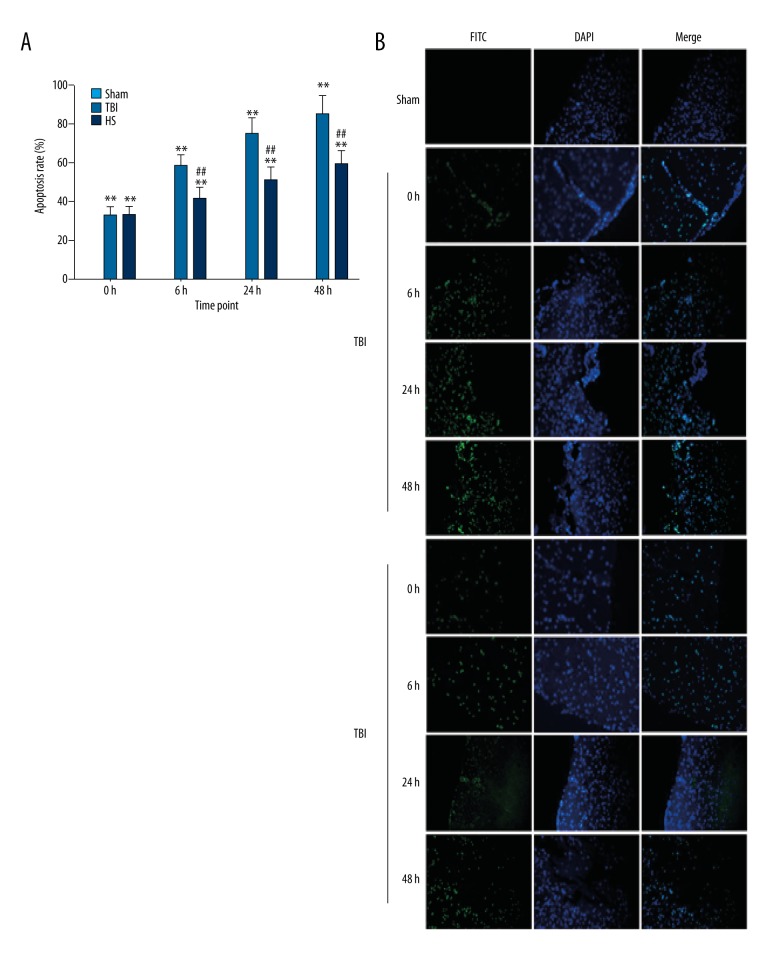
Figure 5.
Detection of apoptotic cells in brain tissue following TBI and HS treatment. (A) Apoptosis rate was determined at indicated time points the TBI, HS, and sham groups. * P<0.05, ** P<0.01 vs. sham group; # P<0.05, ## P<0.01 vs. TBI group. (B) Detection of apoptotic cells with the TUNEL assay.

