Fig. 1.
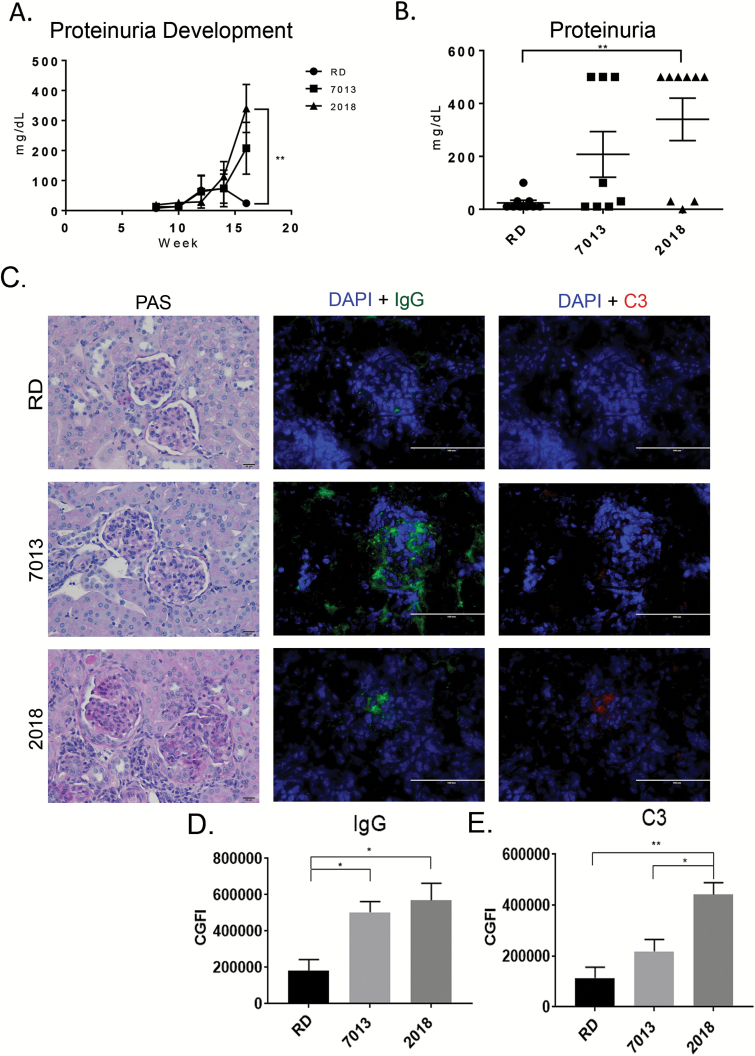
Diet source influences proteinuria and immune complex deposition. (A) Mean urine protein over time measured by ChemStix. Urine protein was monitored every other week starting at 8 weeks of age. (B) The graph represents the mean urine protein concentration at the study end-point. Data are shown as mean ± SEM (n = 8 mice for 7013, 9 mice for 2018 and RD groups). (C) Representative micrographs of PAS-stained, formalin-fixed renal sections (bar equals 20 µm, ×20 magnification) and immunofluorescence stain of immune complex deposition in frozen renal sections (bar equals 100 µm, ×20 magnification). IgG immune complex deposition is shown in green, complement C3 protein deposition is shown in red and slides were counterstained with DAPI (blue). (D, E) Mean fluorescence intensity of IgG (D) and C3 (E) per glomerulus determined by Fiji/ImageJ image. Fifteen glomeruli per mouse were analyzed. ns, not significant, *P < 0.05, **P < 0.01, one-way ANOVA. Data are shown as mean ± SEM (n = 4 mice per group).

