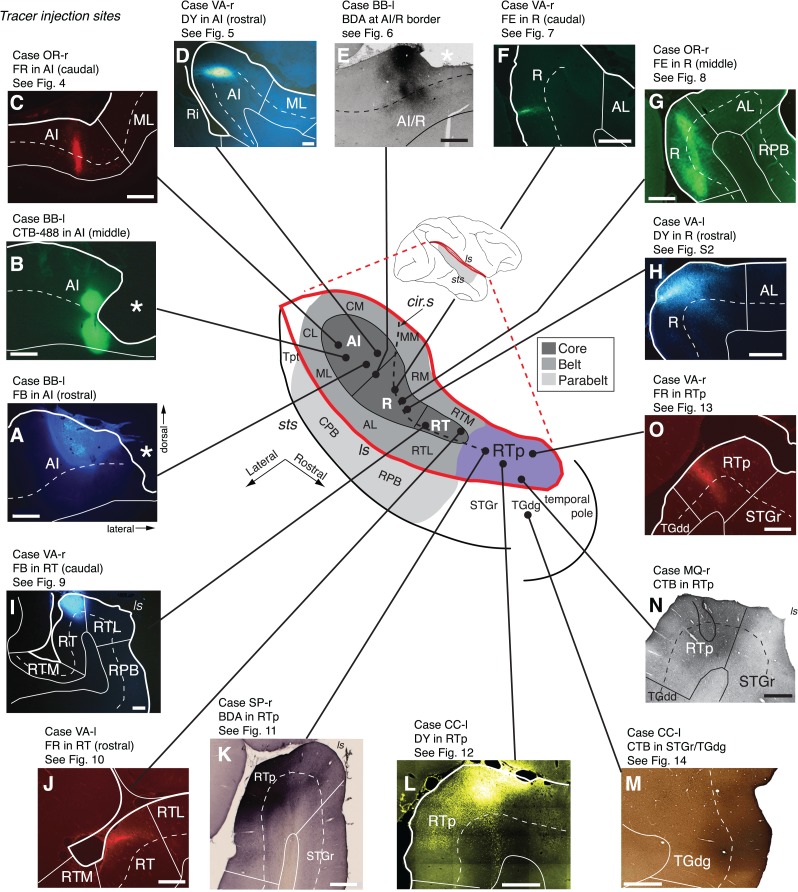
Figure 1.
Subdivisions of the auditory cortex in the supratemporal plane (STP) and the superior temporal gyrus (STG), and the sites of the tracer injections in STP. The lateral sulcus (ls), outlined in red on a lateral view of the macaque right hemisphere (inset), is opened to show 3 core areas (dark gray), 4 medial and 4 lateral belt areas (medium gray), and area RTp (purple) on the surface of the STP, illustrated schematically at the center. The rostrocaudal extent of the parabelt areas (light gray) on the STG is also illustrated in the schematic diagram and on the lateral view of the brain. The curved dashed line within the diagram indicates the approximate location of the circular sulcus. Black dots mark tracer injection sites along the caudorostral extent of the STP. A photomicrograph of each injection site from caudal to rostral (AI-R-RT-RTp) is arrayed clockwise from A to H, and counterclockwise from I to O. The laminar involvement of these injection sites is indicated in Table 1. The bold outline indicates the pial surface (in fluorescence photomicrographs only), a solid thin line marks the border between the gray and white matter, and a dashed thin line indicates layer 4. The black outline in N indicates needle damage visible in an adjacent thionine-stained section (not shown). Asterisks in A, B, and E indicate postmortem tissue damage. The text above each photomicrograph indicates: 1) Case identifier, composed of a two-letter subject code followed by “l” or “r” to indicate left or right hemisphere, 2) the tracer and target region, and 3) reference to the corresponding data figure, if applicable. In all figures, images from the left hemisphere are flipped to a right-hemisphere orientation for consistency. See Table 2 for the different auditory areas and sulcus designations. Scale bars = 1 mm.

