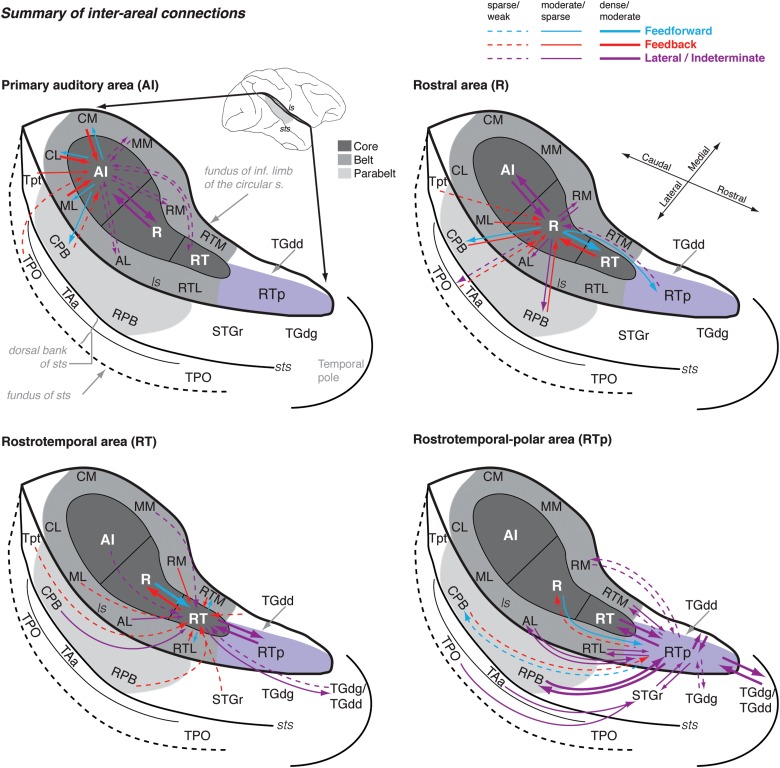
Figure 15.
Summary of the interareal connections of the STP. The schematic diagram of the STP and surrounding auditory and auditory-related areas is the same as in Figure 1, except that it has been modified to include the dorsal bank of the sts (TAa and TPO) and to represent the temporo-polar areas adjacent to RTp (TGdg and TGdd). Different color arrows reflect likely hierarchical relationships between areas: Blue, feedforward (ascending) connections; red, feedback (descending) connections; and purple, connections that are lateral (i.e., do not traverse a hierarchical level) or in which no clear hierarchical pattern is evident in the data. Thick, thin, and dashed lines indicate strong, moderate, and weak connection strength, respectively. The injections have been split into 4 figures, representing the connections of AI, R, RT, and RTp. In each division of the core (AI, R, and RT), connections are primarily with adjacent areas of the core and belt. However, this arrangement is not strictly the case: one AI case showed a connection with RT; R shows weak connections with area RTp and parabelt; and the connections of RT range from area Tpt to the temporal pole. This pattern of more heterogeneous connectivity at more rostral locations reaches its zenith in RTp, which is broadly interconnected with rostral core and belt, parabelt, STGr, and the temporal pole. Input from the dorsal bank of the sts (TPO and TAa) is shown as terminating lateral to RTp, as this connection was not found consistently for injections well confined to RTp and is more characteristic of STGr and the temporal pole area TGdg (Fig. 14).

