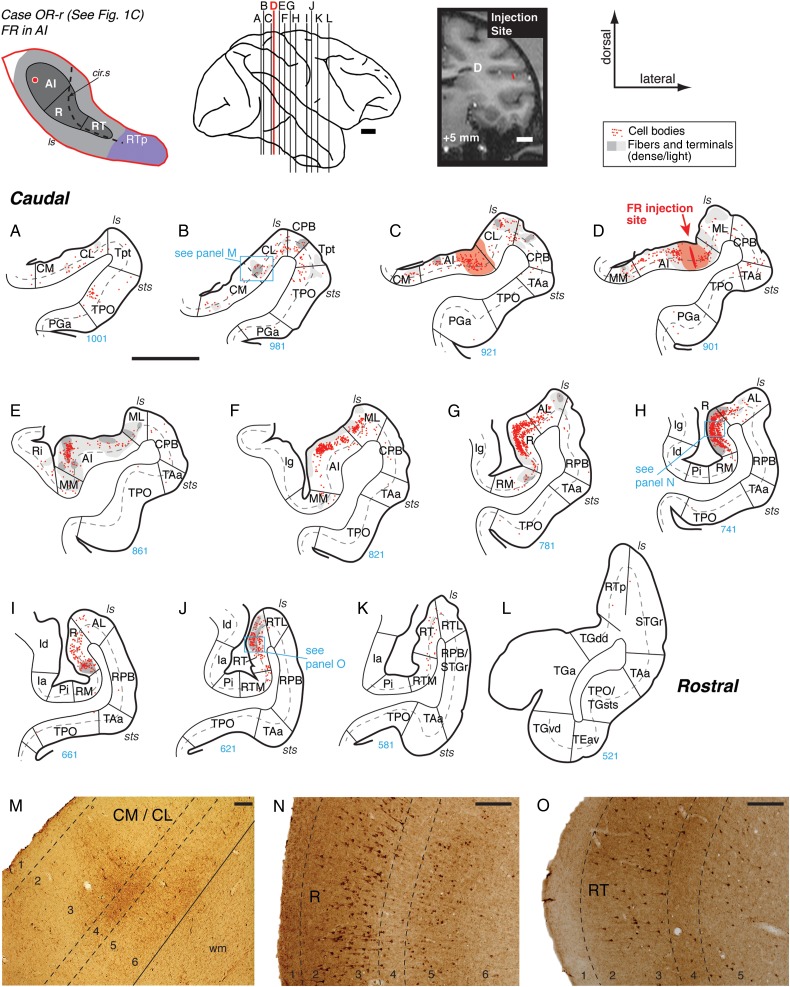
Figure 4.
Connections of primary auditory area AI in case OR-r. (A–L) Distribution of labeled cells and terminals in the auditory and neighboring temporal cortical areas after a bidirectional tracer (FR) injection into caudolateral AI (section D; see also Figs 1C and 2B). The schematic diagram at the top left indicates the location of the AI injection site on the STP (same as in Fig. 1). Each red dot represents one cell labeled by retrograde transport of FR, and gray shading marks the fields of axonal fibers and synaptic terminals labeled by anterograde transport (dark and light gray indicate dense and light label, respectively). Red shading in (C and D) indicates the halo around the injection site where background staining was high and anterograde label could not be reliably identified (C and D). In this and other figures, only those portions of the coronal section are depicted that include the STP (core/belt/RTp), STG (parabelt/STGr), dorsal bank of the sts, temporal pole, and adjacent parts of the insula. The corresponding caudorostral location of each section is illustrated on the lateral view of the brain at the top center; the bold red line indicates the section in which the injection site was located (AP +5; arrow in D). The injection site is also indicated on the corresponding coronal MRI slice from the same animal at the top right. As in Figure 1, thick lines in A–L indicate the pial surface, thin lines indicate the border between gray and white matter, dashed gray lines indicate layer 4, and radial lines mark the boundaries between cortical areas. The section number is provided under each panel (in blue), allowing the distance between any 2 sections to be calculated from the section thickness of 40 µm. Blue boxes on plotted sections indicate corresponding photomicrographs at the bottom of the figure (e.g., label in section B is illustrated in panel M). This injection identified reciprocal connectivity with the belt areas caudal and lateral to AI (panels A–F), as well as weaker connections with medial belt and caudal parabelt area CPB (B–E and M). The strongest connection of AI was with area R, where cells and terminal label were dense throughout the supragranular layers and layer 5 (G, H, and N). A similar but weaker distribution of filled cells was evident in the caudal portion of area RT (J and O). No significant label was observed in RTp. See Table 2 for area and sulcus designations. Scale bars = 5 mm in panels A–L and in the lateral brain view and coronal MRI at the top, and 0.2 mm in panels M–O.

