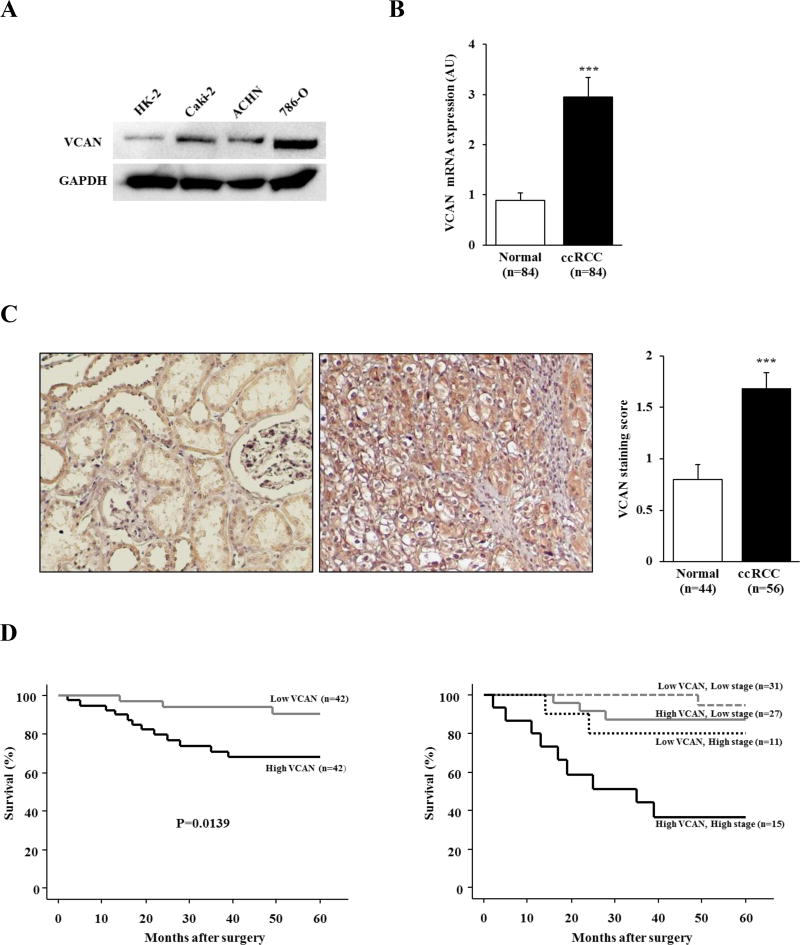
Figure 1. VCAN expression and it’s correlation with prognosis in ccRCC.
(A) Representative immunoblot displaying VCAN expression in HK-2, Caki-2, ACHN and 786-O cells. VCAN protein was upregulated in RCC cell lines in comparison with that of HK-2. GAPDH used as loading control. (B) mRNA expression of VCAN in 84 matched clinical samples. ccRCC samples showed a significantly higher level of VCAN expression in comparison with normal renal tissues. ***, P<0.001. (C) Representative VCAN staining (left) and scoring (right) of available clinical samples. VCAN protein expression in ccRCC samples was significantly higher than that of normal kidney tissues. ***, P<0.001. (D) Kaplan-Meier curves for 5-year overall survival (OS) after radical nephrectomy. Left: Patients with high VCAN expression were significantly associated with lower 5-year OS (P=0.0139). Right: Stratification of VCAN expression with tumor stage identified a stepwise reduction of 5-year OS rate.

