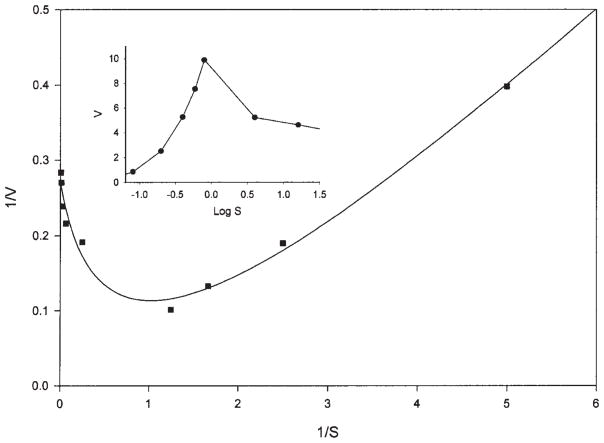
Fig. 5.
Lineweaver-Burk plot of the Orpinomyces BglA on hydrolysis of cellobiose (0.04–16 mM). The release of glucose was measured. Reciprocal initial velocities (mg/U) are plotted against the reciprocal concentrations of substrates (1 mM). The inset is a plot of initial velocities (U/mg) against the log cellobiose concentrations (mM).

