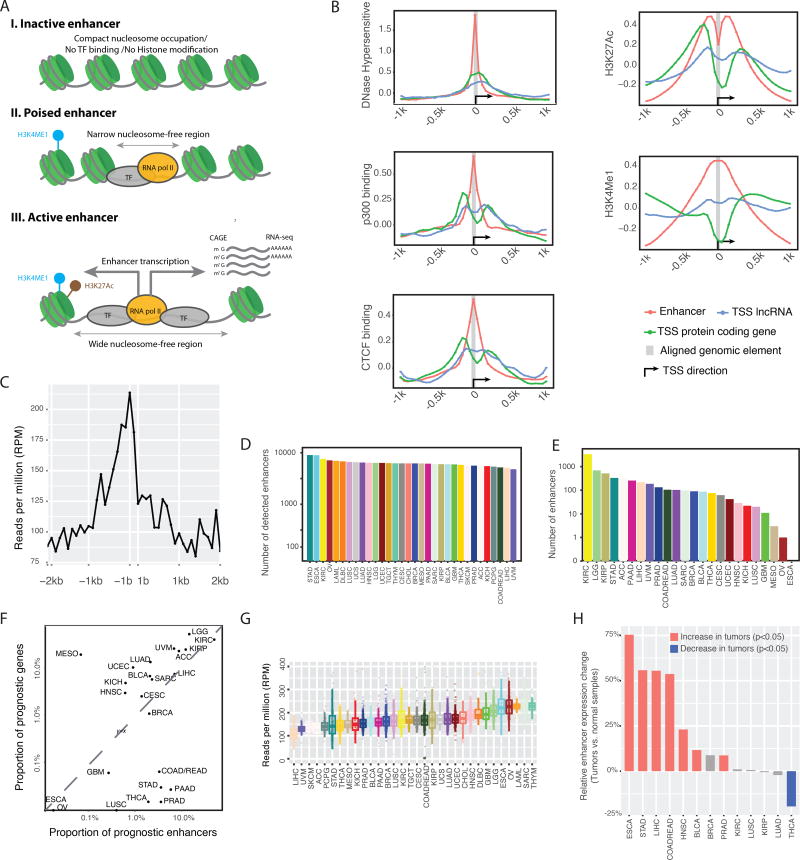
Figure 1. Overview of enhancer expression in TCGA RNA-seq data.
(A) When activated, expressed enhancers may generate RNA molecules detectable by RNA-seq. (B) The chromatin status of enhancers, TSSs of protein-coding, and lncRNA genes, as well as their flanking 1-kb regions. The y-axis shows the normalized ChIP-seq signals from the ENCODE bigwig files. (C) Transcription of enhancers and their flanking 2-kb sequences detected in TCGA RNA-seq dataset. The y-axis shows the average reads per million mapped (RPM) to the nucleotide at the relative position from an enhancer, as indicated on the x-axis. Flanking sequences that overlapped with known genes were excluded from the calculation. (D) Numbers of expressed enhancers in different cancer types. An enhancer was considered as expressed in a cancer type if observed in >10% of the samples. (E) Numbers of prognostic enhancers in different cancer types. For each enhancer, its correlation with patients’ survival times in a given cancer type was calculated using Cox regression. The p-value was subjected to multiple-testing correction with FDR = 0.05 as cut-off. (F) Comparison of the proportion of prognostic enhancers and coding genes across cancer types, given the same patient cohorts and FDR cutoffs as in E above. (G) The variation in enhancer expression within and across cancer types. (H) Global enhancer activation in cancer as determined through comparison of matched tumor-normal pairs. Thirteen cancer types with >10 tumor–normal pairs were considered. The y-axis shows changes in global enhancer expression (RPMtumor/RPMnormal −1)%; statistics were performed with paired t-test. See also Figure S1.

