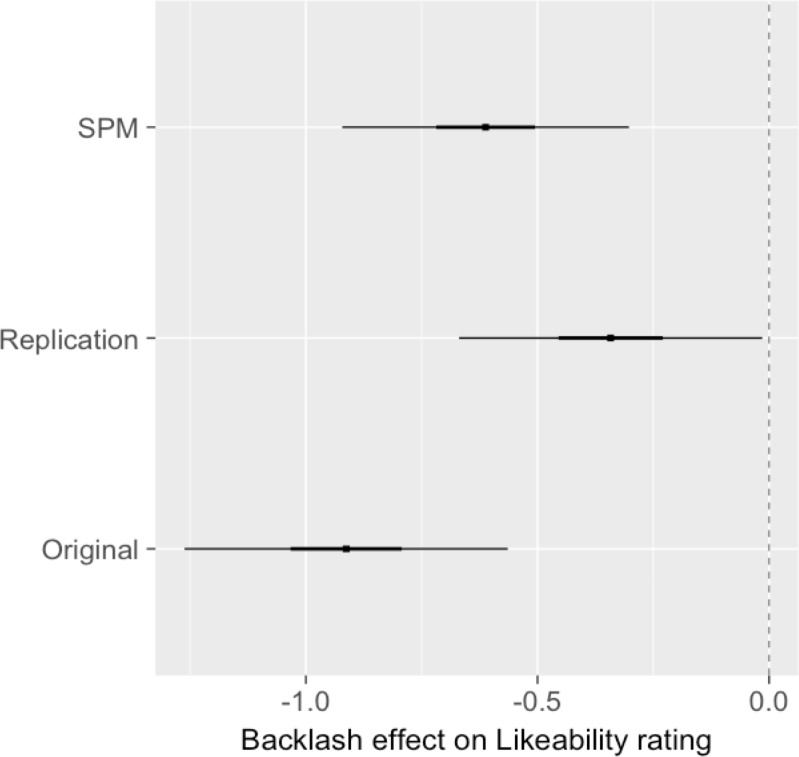
Fig 2. Likeability backlash effect estimates in Experiment 2 (original) and 3 (replication), as well as the single paper meta-analysis (SPM) estimate of the true effect (50% and 95% intervals also shown).
The scale of the response corresponds to the average change in Likeability rating when assigned a vignette of the opposite gender, relative to expectations given sex and vignette averages alone.

