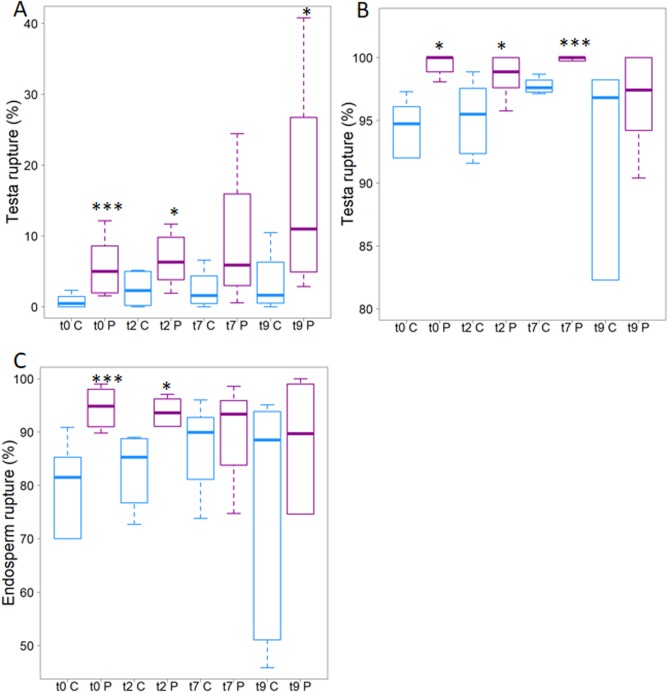
Fig 3. Air plasma stimulated germination rate of A. thaliana.
Boxplots show control (cyan) and treated (magenta). A. Testa rupture as a function of time between treatment and imbibition (times t0, t2, t7 and t9 are given in days), observed 24 h after imbibition. B. As panel A but observations made at 40 h after imbibition. C. Endosperm rupture (observations at 40 h). Six hundred seeds are counted for each of the four considered batches. Wilcoxon test has been used to test the significance between the means, the p-value is: * < 0.05; *** < 0.002 (For data see S1 Fig).

