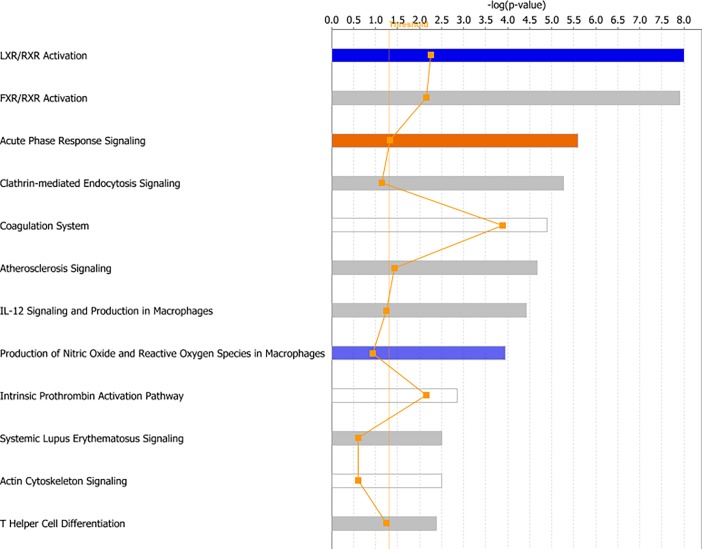
Fig 7. Canonical pathways found by core analysis in IPA of the 5-year survival categories.
The top canonical pathways enriched by Ingenuity Pathway Analysis (IPA) are shown above. The straight orange vertical line running through the bars is the threshold for the p-value for the particular pathway’s enrichment. The horizontal axis is the–log(p-value) and the vertical axis shows the given pathways.

