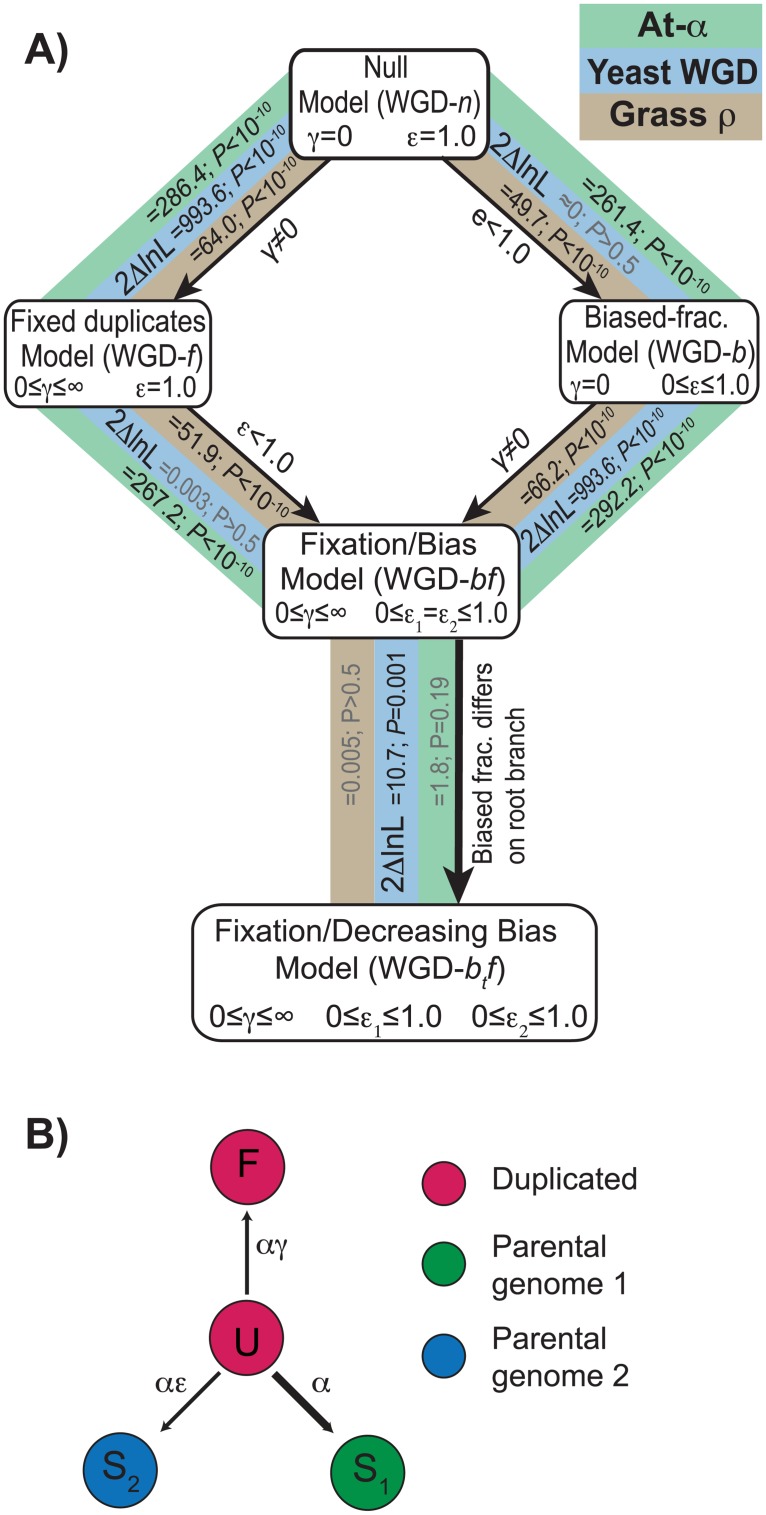
Fig 2. Modeling WGD resolution with POInT.
We employed a number of models of the fates of the duplicates produced by WGD. A) Statistical relationships between the various models for the yeast WGD (blue), At-α (green) and ρ (brown) events. The simplest model (WGD-n) considers only a balanced process of gene loss. From this model, we can either allow duplicate genes to become fixed (for instance by neo- or sub-functionalization, WGD-f) or for one of the two parental subgenomes to lose more genes than the other (WGD-b). Using a likelihood ratio test (LRT), we find that, for all three WGD events, allowing duplicate fixation significantly improves the fit of the data to the models (P<10−10, LRT, Methods). However, for the yeast dataset, there is no significant evidence for biased fractionation (P>0.5, LRT), while for the two plant WGDs, adding it significantly improves the fit (P<10−10; LRT). From these two models, we can then allow the other process. Again, for yeast, there is significant evidence for fixation but not biased fractionation (P<10−10 and P>0.5, respectively, LRT) while for At-α and ρ, there is significant evidence for both (P<10−10 in each case, LRT). We also tested a model where the biased fractionation parameter ε (see panel B) was allowed to differ on the shared root branch of the tree (WGD-btf) compared to all of the other branches. For the two plant WGD events, there is no significant evidence that the level of biased fractionation differed early in history of the WGD relative to later in time (P≥0.19, Results). On the other hand, for the yeast WGD, biased fractionation was much more intense soon after the polyploidy event and weakened later (P = 0.001; Results). B) Model states and parameters. Our model has four states, two duplicated ones (U = undifferentiated duplicates and F = fixed duplicates) and two single copy states (S1 and S2, corresponding to the two parental subgenomes). The base loss rate (α) is compounded with the estimated time to give the branch lengths of Fig 1. The relative fixation rate γ (0≤γ<∞) gives the rate of duplicate fixation relative to the loss rate α. Likewise, the fractionation bias parameter ε (0≤ε≤1) gives the excess of preservations from subgenome 1 relative to subgenome 2 (assumed to be the more fractionated subgenome).

