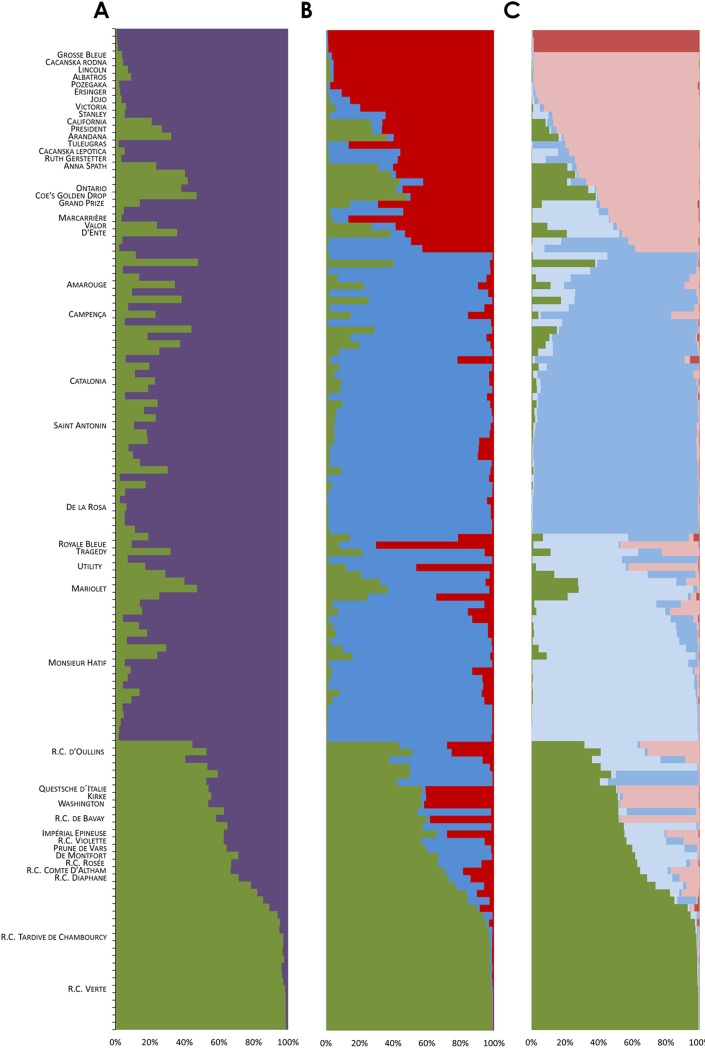
Fig 2. Graphical display of the results of the STRUCTURE analyses.
Proportions of ancestry of 135 unique genotypes for groups inferred at K = 2 (A), K = 3 (B) and K = 5 (C). Each genotype is represented by a horizontal bar partitioned into two, three and five segments representing the estimated membership fraction in the groups obtained when K = 2, K = 3 and K = 5 were considered, respectively. Genotypes are presented in the same order in A, B and C. The groups inferred at K = 2 are depicted in green (G2.1) and in purple (G2.2). The groups inferred at K = 3 are depicted in green (G3.1), in blue (G3.2) and in red (G3.3). The groups inferred at K = 5 are depicted in green (G5.1), in light blue (G5.2), in dark blue (G5.3), in light pink (G5.4) and in dark pink (G5.5).

