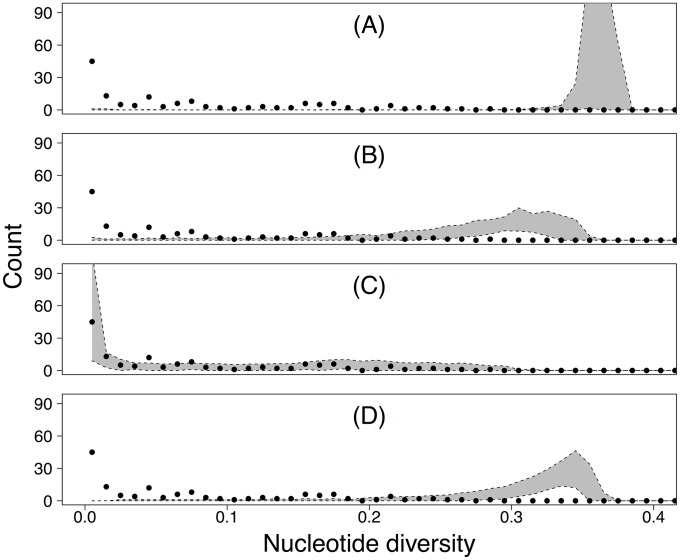
Fig 3. Fit of models to data.
Comparison of the predictions of our models (gray-shaded areas, showing 95% CIs of model realizations) to the distribution of nucleotide diversity within 143 individual infected hosts calculated from our sequence data (black dots show data on nucleotide diversity within hosts). Panel A shows the predictions of a model that lacks both transmission bottlenecks and replicative drift, panel B shows the predictions of a model that includes transmission bottlenecks but not replicative drift, panel C shows the predictions of a model that includes both transmission bottlenecks and replicative drift, and panel D shows the predictions of a model that includes purifying selection within hosts but not transmission bottlenecks or replicative drift. Values underlying data points are provided in S1 Data.

