
Figure 3.
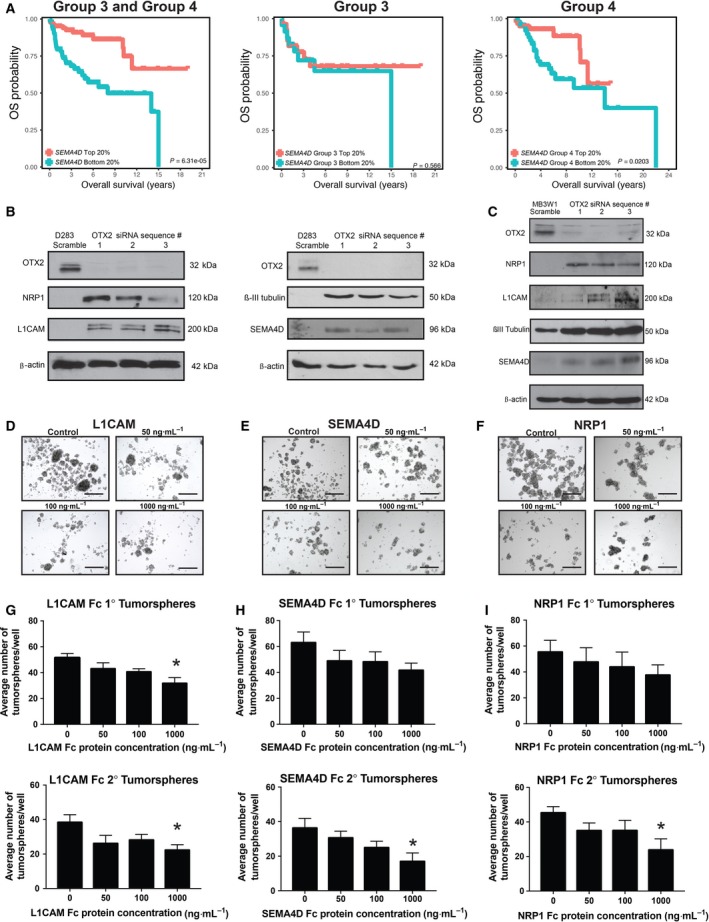
Semaphorin genes are negatively correlated with OTX2 expression and self‐renewal in MB tumorspheres. (A) Kaplan–Meier curves of Group 3 and Group 4 patients with high (red) and low (blue) SEMA4D expression for Group 3 and Group 4 combined (left), Group 3 alone (middle), and Group 4 alone (right). (B) Immunoblots depicting increases in NRP1, L1CAM, PLXNA2, SEMA4D, and βIII‐tubulin protein levels following OTX2 knockdown in D283 tumorspheres. β‐Actin serves as a loading control. (C) Immunoblots depicting increases in NRP1, L1CAM, SEMA4D, and βIII‐tubulin protein levels following OTX2 knockdown in MB3W1 tumorspheres using three siRNA sequences. β‐Actin serves as a loading control. (D–F) Representative images of D283 tumorspheres following 5‐day treatment with recombinant L1CAM Fc (D), SEMA4D Fc (E), or NRP1 Fc (F) chimera protein. N = 4 biological replicates. (G–I) Total number of primary (upper) and secondary (lower) tumorspheres following 5‐day treatment with L1CAM Fc (G) SEMA4D Fc (H) or NRP1 Fc chimera protein (I). N = 4 biological replicates. Error bars: SEM. P < 0.05*. Scale bar: 400 μm.