Figure 4.

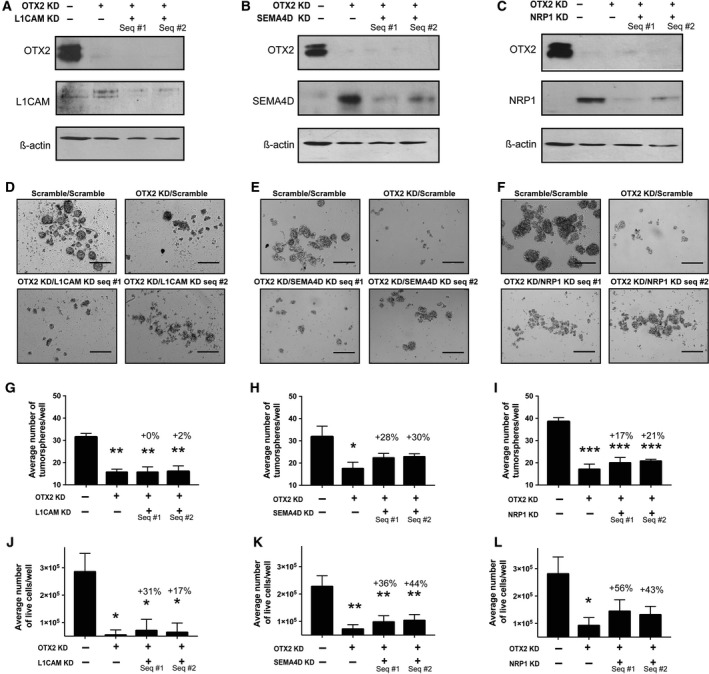
Decreased levels of semaphorin pathway genes in OTX2 KD cells result in a partial rescue of tumorsphere formation and growth. (A–C) Immunoblots depicting OTX2 and either L1CAM (A) SEMA4D (B) or NRP1 (C) protein levels following dual OTX2 and L1CAM, SEMA4D, or NRP1 knockdown in D283 tumorspheres over 5 days. β‐Actin serves as a loading control. (D–F) Representative images of D283 tumorspheres following dual OTX2 and either L1CAM (D), SEMA4D (E), or NRP1 (F) knockdown. Scale bar: 400 μm. (G–I) Quantification of tumorsphere number following dual OTX2 and either L1CAM (G), SEMA4D (H), or NRP1 (I) knockdown in D283 tumorspheres over 5 days. Note the partial recovery of tumorsphere number in the SEMA4D and NRP1 double knockdowns. Error bars: SEM. P < 0.05*, P < 0.01**, P < 0.001***. For all experiments, N = 3 or N = 4 biological replicates. (J–L) Quantification of total live cell number following dual OTX2 and either L1CAM (J), SEMA4D (K), or NRP1 (L) knockdown in D283 tumorspheres over 5 days. Error bars: SEM. P < 0.05*, P < 0.01**. For all experiments, N = 3–8 biological replicates.
