
Figure 5.
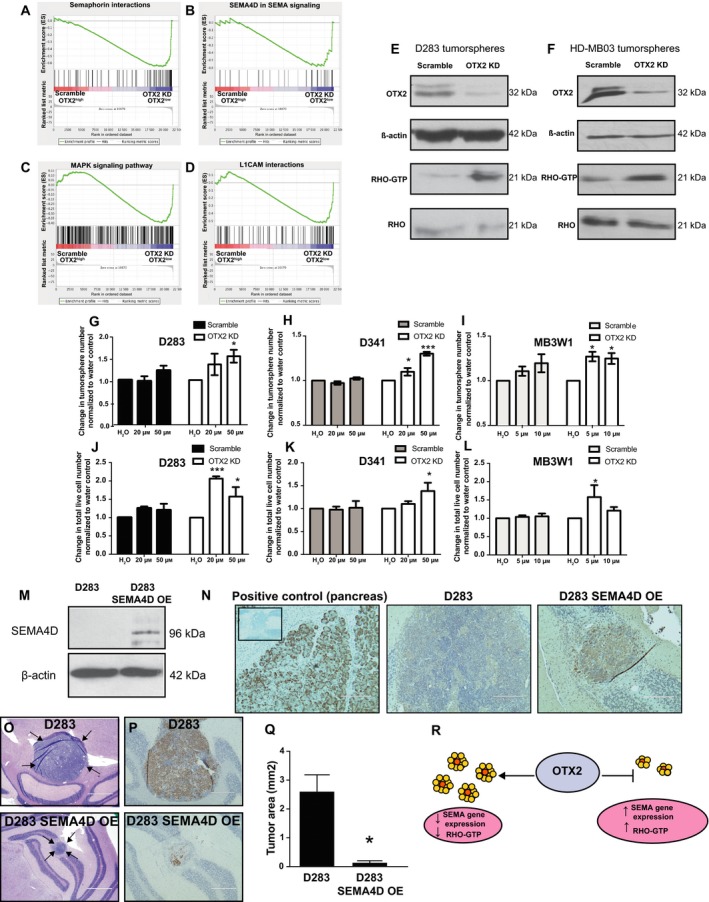
OTX2 levels are negatively correlated with activation of RHO signaling. (A–D) Gene set enrichment analysis (GSEA) demonstrating that genes associated with SEMA interactions (A), SEMA4D signaling (B), MAPK signaling (C), and L1CAM interactions (D) were enriched in genes sets that are downregulated in the scramble and upregulated in the OTX2 KD D283 tumorspheres. (E,F) Detection of the GTP‐bound form of active RHO in a pull‐down assay from scramble and OTX2 KD D283 (E) and HD‐MB03 (F) tumorsphere lysates. β‐Actin serves as a loading control for OTX2. Total RHO serves as a loading control for RHO‐GTP. (G–L) Treatment of D283 (G,J) and D341 (H,K) and MB3W1 (I,L) scramble (SC) and OTX2 KD tumorspheres with the RHO‐associated, coiled‐coil containing protein kinase (ROCK) inhibitor Y‐27632 results in a significant increase in tumorsphere number and total live cell number specifically in OTX2 KD cells relative to H2O controls, N = 3 biological replicates for D283 and MB3W1; N = 4 biological replicates for D341. Error bars: SEM. P < 0.05*, P < 0.001***. In addition to the treatment effects within the OTX2 KD cells, there was also a statistically significant difference between the scramble and the OTX2 KD tumorspheres in (H) (P < 0.001***) and (J) (P < 0.01**). Note that for MB3W1, higher concentrations were toxic; thus, the assays were performed at 5 and 10 μm. (M) Immunoblot validation of stable SEMA4D OE in D283 tumorspheres. β‐Actin serves as a loading control. (N) Representative images of SEMA4D staining in the pancreas (positive control for SEMA4D expression) (left) as well as tumors derived from D283 (middle) or D283 SEMA4D OE (right) following injection into NOD SCID mice. Inset: secondary antibody only negative control. Scale bar: 200 μm. (O) Representative images of tumors derived from D283 control or D283 SEMA4D OE tumorspheres following injection into the cerebellum of NOD SCID mice. Scale bar: 1000 μm. Arrows denote intracerebellar tumors from each. (P) Representative images of Ki67 staining in tumors derived from D283 control or D283 SEMA4D OE tumorspheres following injection into the cerebellum of NOD SCID mice. Scale bar: 400 μm. (Q) Quantification of tumor area in the vermis following intracerebellar injection of 2 × 10⁵ D283 control or D283 SEMA4D OE tumorsphere cells. Error bars: SEM. P < 0.05*. (R) Working model depicting the relationship between OTX2, SEMA gene expression, and RHO activity. OTX2 levels are inversely correlated with SEMA gene expression and RHO activity. Increased expression of SEMA genes and RHO activity is associated with decreased self‐renewal and growth and a more differentiated phenotype.