
Table 1.
Correlation between OTX2 and expression of axon guidance genes in Group 3 and 4 MB patient samples. Genes exhibiting a statistically significant negative correlation are depicted in blue and those exhibiting a positive correlation are shown in red. FDR < 0.1
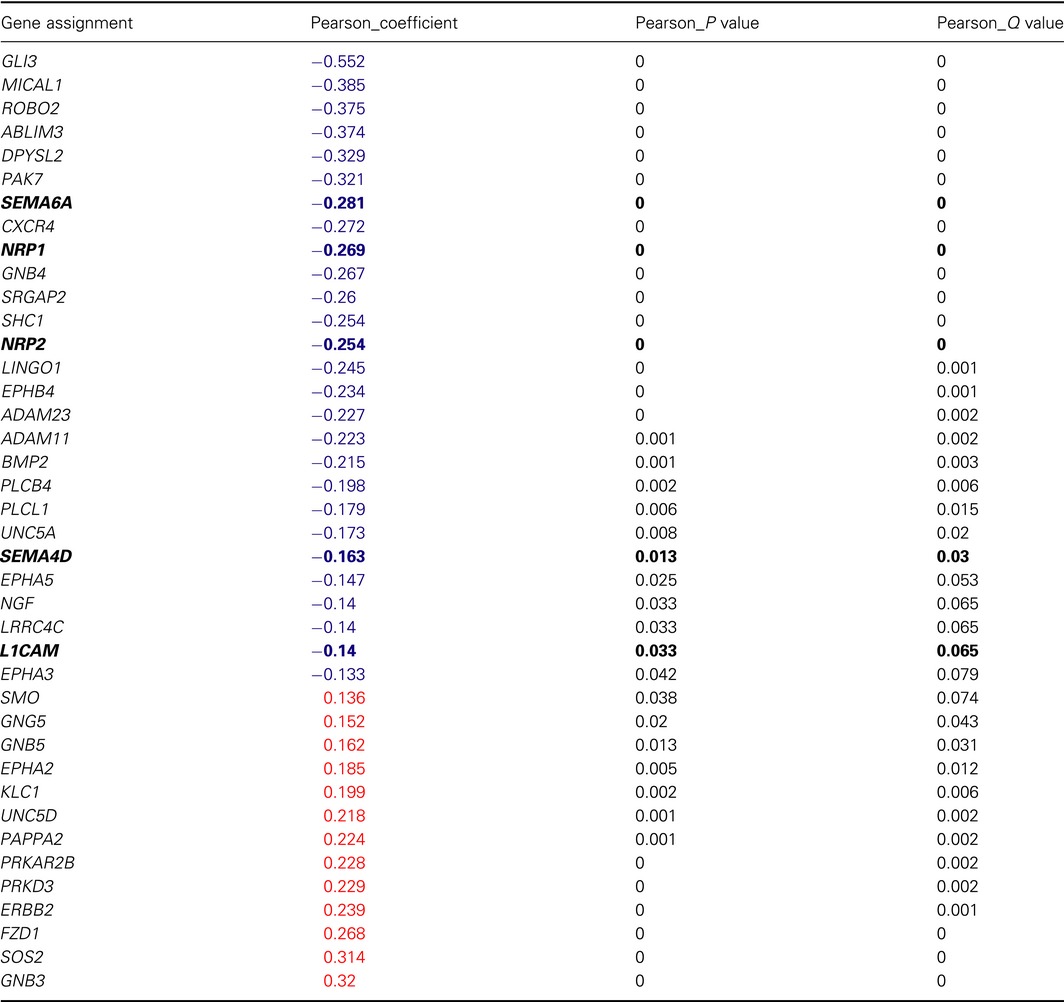
Semaphorin pathway genes are highlighted in bold.