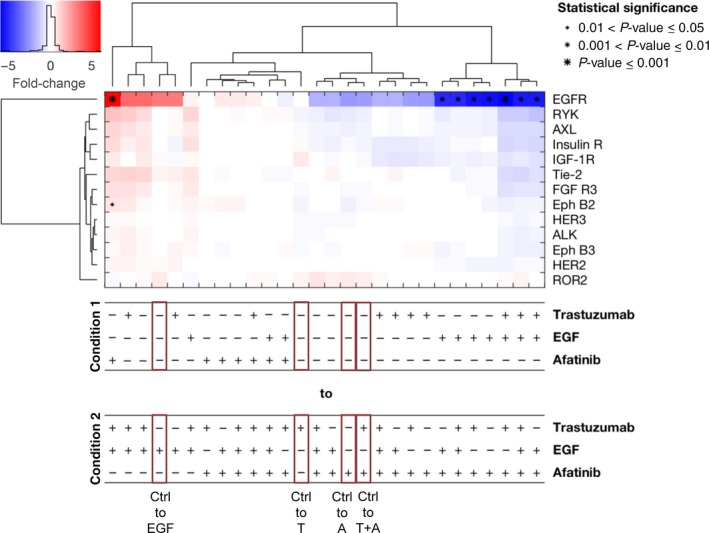
Figure 3.

RTK Proteome Profiler analyzed by a mixed‐effect model with clustering and statistical analysis for the cell line MKN1. The RTK Proteome Profiler was performed to detect the effects of trastuzumab, afatinib, and/or EGF treatment on different RTKs in MKN1 cells. The cells were treated for 20 min with 5 μg·mL−1 trastuzumab, 0.5 μm afatinib, or 5 ng·mL−1 EGF alone as well as in combination with each other. The phosphorylation levels were quantified using densitometric analysis; a linear mixture modeling was inferred. In the cluster analysis, the x‐fold change of each activated protein is shown. Samples were clustered due to the similarity of the activated proteins and treatment conditions. Significant effects between different treatment conditions are indicated by (*) with increasing size (0.01 < P‐value ≤ 0.05, 0.001 < P‐value ≤ 0.01, and P‐value ≤ 0.001). A, afatinib; T, trastuzumab; Ctrl, control.
