
Figure 9.
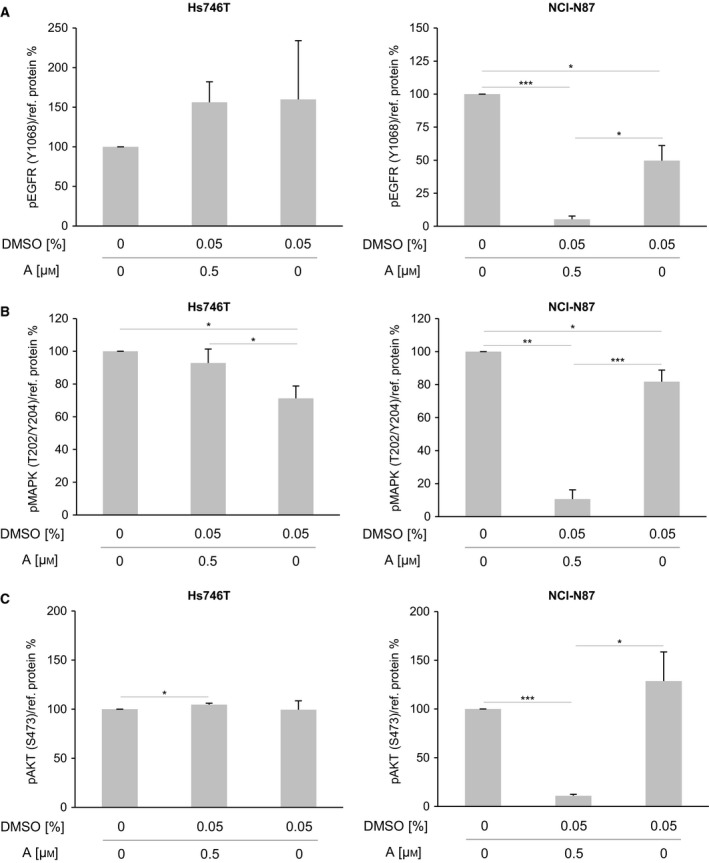
Effect of afatinib on the activation of EGFR, MAPK, and AKT in Hs746T and NCI‐N87 cells. The levels of activated receptors were determined by western blot analysis with pEGFR‐specific (Y1068), pMAPK‐specific (T202/Y204), and pAKT‐specific (S473) antibodies after a 5‐min treatment of Hs746T or NCI‐N87 cells with afatinib (0.5 μm) or DMSO (0.05%). pEGFR analysis for NCI‐N87 cells was already shown in Fig. S1. The average phosphorylation levels were quantified using densitometric analysis and calculated in relation to the levels of the reference proteins α‐tubulin and β‐actin (+SD). Significant effects are indicated by *0.01 < P‐value ≤ 0.05, **0.001 < P‐value ≤ 0.01 or ***≤ 0.001. A, afatinib.