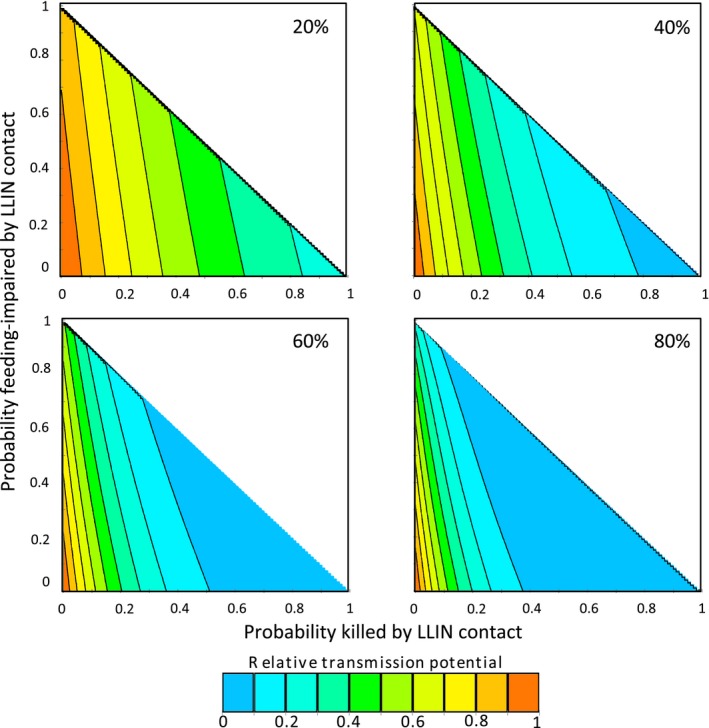
Figure 7.

Changes in relative transmission potential for combinations of assumed probabilities of long‐lasting insecticidal bed net (LLIN)‐generated mortality and feeding impairment per feeding attempt. Panels show the relative transmission potential (RTP) of a mosquito population exposed to various levels of LLIN coverage, compared to the RTP if no bed nets were present. Axes represent the probability, during each feeding attempt on an LLIN‐protected host, of prebite mortality (x‐axis) or feeding impairment (y‐axis) caused by the LLIN. Proportion killed plus proportion impaired cannot exceed 100%, so plots are only generated in range x + y ≤ 1
