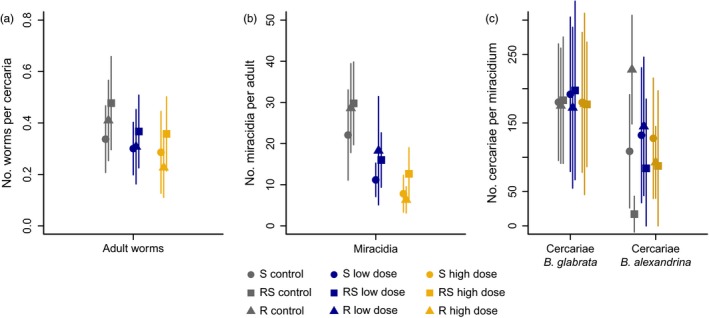
Figure 2.

Raw data counts of Schistosoma mansoni in the different life cycle stages for each parasite line (symbols: S susceptible; R: resistant; RS: resistant–susceptible) and praziquantel treatment group (colours). Average number (±standard deviation) of (a) adult worms per cercaria and (b) miracidia per adult worm/day and (c) the weekly number of cercariae produced per miracidium (right) are estimated across the four generations for each line/treatment group
