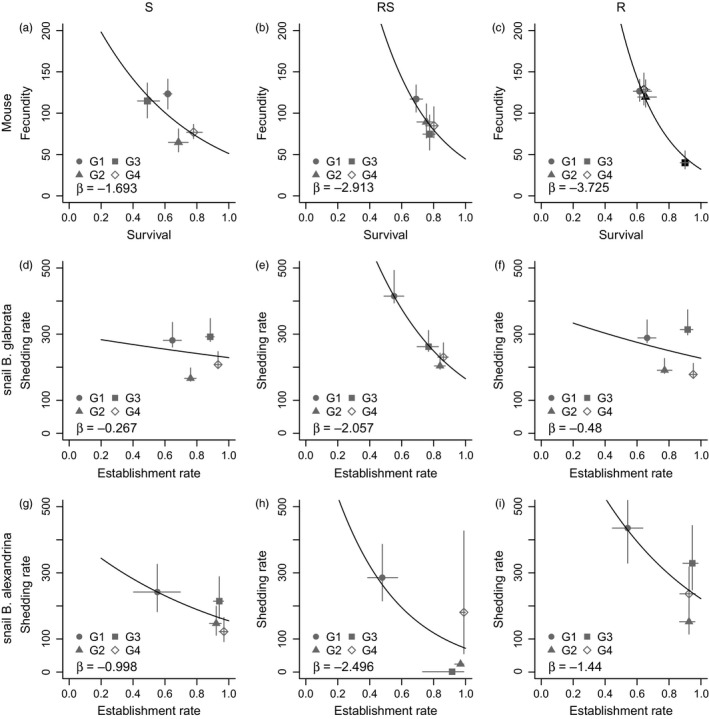
Figure 3.

Untreated control (baseline) life‐history traits and trade‐offs in the definitive (a–c) and intermediate (d–i) hosts. For each Schistosoma mansoni line, susceptible (S; left), mixed resistant and susceptible (RS; middle) and resistant (R; right), the median (with 95% CIs) life‐history traits (x‐ and y‐axis) are shown for each generation. The trade‐offs between traits (black line and associated slope, β) were obtained from a Poisson GLM of the posterior distributions of survival (a–c) or establishment (d–i) rates against those of fecundity (a–c) or shedding (d–i) rates, respectively. All regressions were significant with p<.001. p‐values and standard deviations shown in Appendix S3 TableS2
