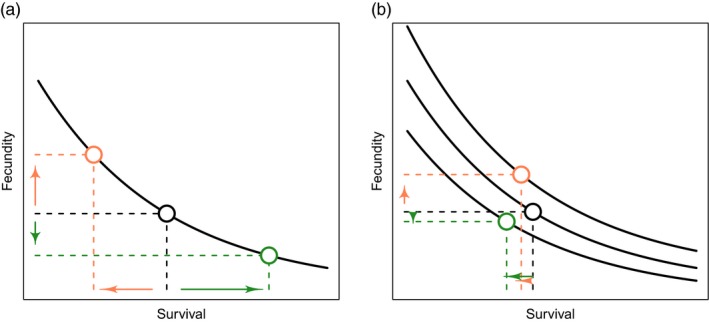
Figure 5.

Life‐history traits quantify an organism's investment into components of fitness, such as reproduction (y‐axis) and survivorship (x‐axis). (a) There are recognized trade‐offs between life‐history traits (solid curve), so that an increase in fecundity is associated with decreased survivorship (orange) or conversely higher survivorship leads to lower fecundity (green). These life‐history trade‐offs arise from limited resources available for an organism's growth, reproduction and survivorship. (b) However, trade‐off curves can shift as resource (energy) availability for certain traits change—this may be due to other resource allocation needs in the organism or a decline in resource availability. When this occurs, negative trade‐offs are difficult to observe and a decline in one trait (orange) may not be compensated by a second observed trait (green). [Figure adapted from work by Noordwijk and de Jong (1986)]
