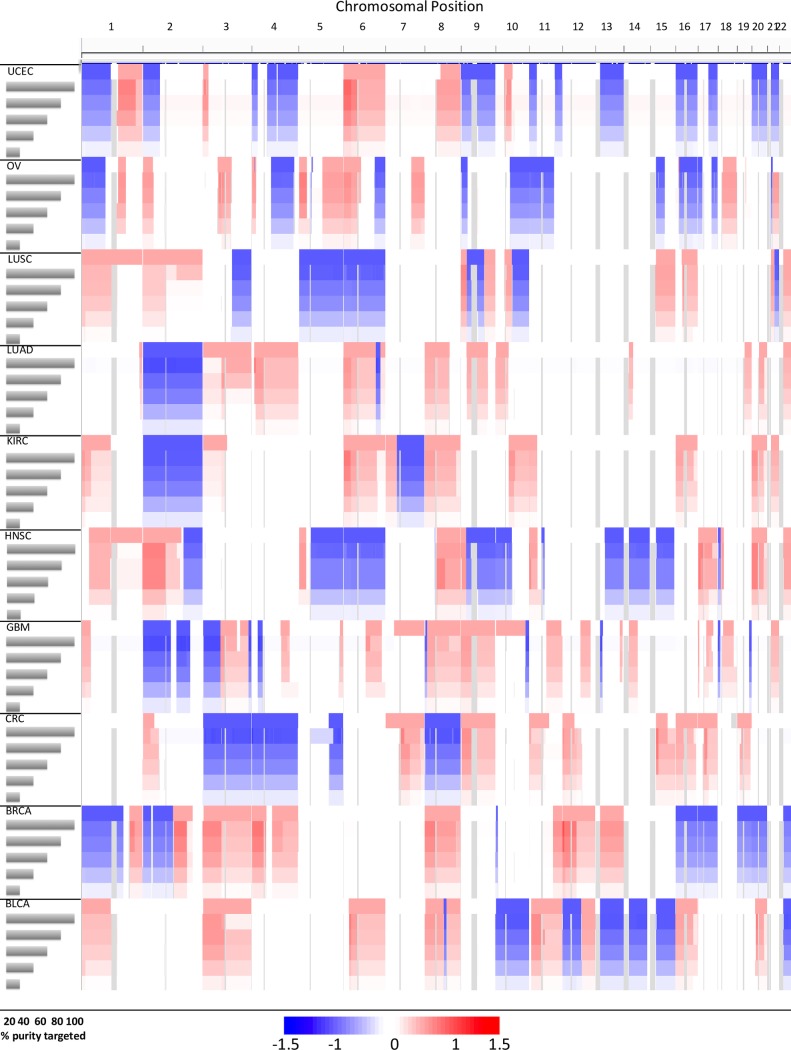
Fig 3. Log2 ratios from simulated exemplar tumors at varying purity levels.
To assess the ability of Bamgineer to recapitulate CNV profiles of known cancers, we compared, from 10 TCGA cancer types, profiles from an exemplar tumour (top track for case) with CNV called from bam files generated by Bamgineer at five purity levels: 100%, 80%, 60%, 40% and 20% (subsequent tracks for each case). Log2 ratios of copy number segments inferred using the Sequenza algorithm, shown as a heatmap (blue: loss, red: gain; data range is -1.5 to 1.5) for different cancers and different tumor cellularities shown for one exemplar tumor for each cancer type. We generated exemplar composite seg files by combining high-ranking tumor profiles from TCGA segments for each cancer defined by similarity score; Eq 6 (top track for each cancer type). The quantized segments from each representative tumor were used as the CNV input for Bamgineer along with a single normal BAM file and sampled to artificially create tumor-normal admixture at the desired purity. The purity value for each tumor type (in gray), is the median purity value for each cancer type according to TCGA segments. As the purity decreases, we observed a corresponding decrease in log2ratios of tumor segments (reduction in color intensities). Occasional discrepancies between exemplar and simulated CNV profiles for each cancer appear to be due to variation in the segmentation of copy number calls by Sequenza as purities fall rather than inaccurate allele-specific coverage at these locations.

