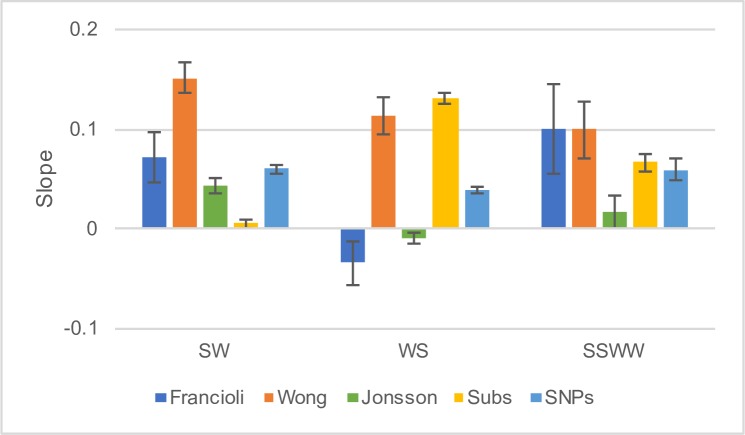
Fig 7. Testing why divergence is correlated to recombination rate.
The slope (and SE) between normalised DNM density and normalised sex-averaged recombination rate (RR) (Wong—blue, Francioli–orange, Jonsson–green), normalised substitution density and RR (yellow) and normalised SNP density and RR (light blue). In each case the values were normalised by dividing by the mean.

