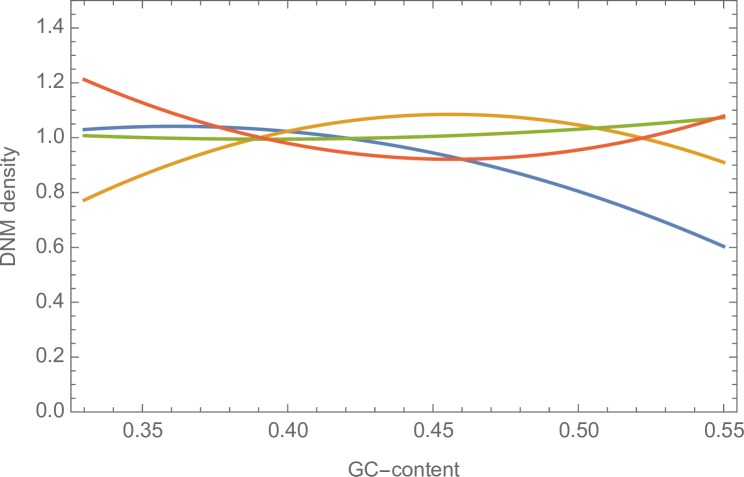
Fig 9. The relationship between DNM density, or divergence, and GC content.
The relationship was estimated from a regression of DNM density or human-chimp divergence, against GC-content and the square of the GC-content at the 1MB scale. Blue–Francioli, Light Orange–Wong, Green–Jonsson and Dark Orange–W<>W and S<>S substitutions between human and chimpanzee.

