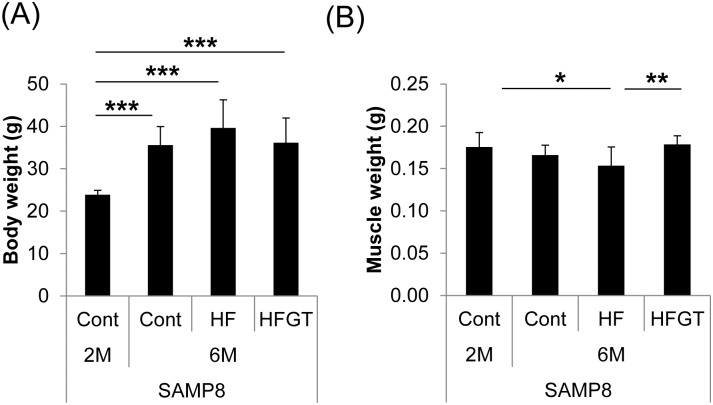
Fig 2. Body weight and skeletal muscle weight in SAMP8 mice on different diets.
Body weight (A); skeletal muscle weight (B). Skeletal muscle loss with aging was exacerbated by an HF diet (2M Cont vs. 6M HF; P = 0.016) but was significantly prevented by GTEs in the HFGT group (HF vs. HFGT; P = 0.002). Data are means ± S.D. (8 to 16 mice per group). One-way ANOVA followed by Tukey’s post-hoc test was used for comparison among groups. *, P < 0.05; **, P < 0.01; ***, P < 0.001.

