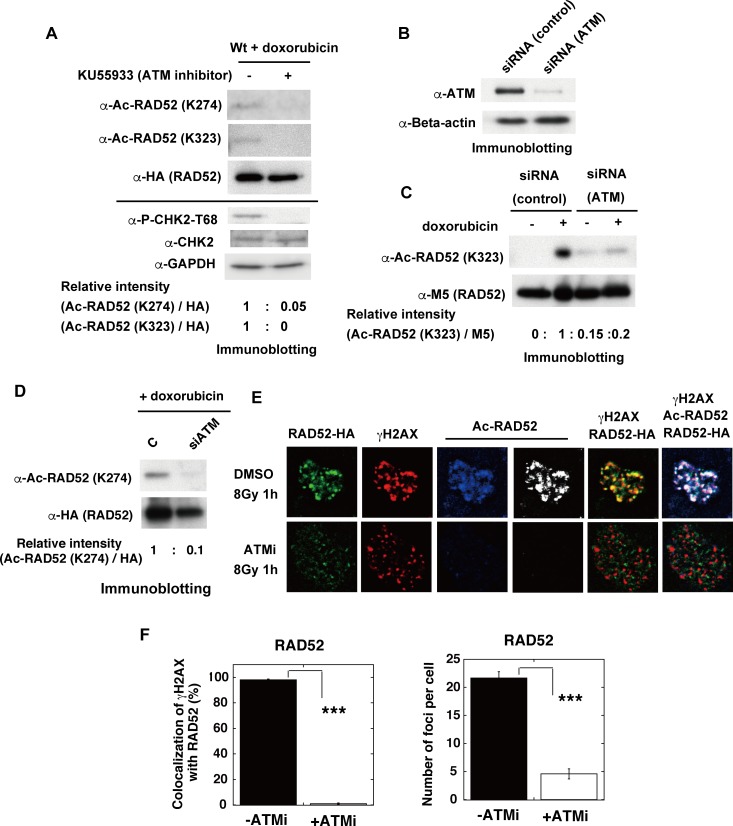
Fig 11. ATM inhibition impedes acetylation of human RAD52 and its recruitment at IR-induced DSB sites.
(A) MSCs were transfected with the expression plasmid pT-Rex-DEST30, containing FLAG-RAD52 (Wt)-HA. Cells were treated with doxorubicin for 2 h at 24 h after transfection. Where indicated, KU55933 (ATMi) was added to the cells at 1 h before the addition of doxorubicin. Immunoprecipitated FLAG-RAD52-HA proteins from the cell extracts were subsequently subjected to immunoblotting analyses with anti-Ac-RAD52 (K274), anti-Ac-RAD52 (K323) and anti-HA antibodies. The cell extracts before the immunoprecipitation were also subjected to immunoblotting analyses with anti-phospho-CHK2-T68, anti-CHK2, and anti-GAPDH antibodies. The relative band intensities normalized to those of the HA bands are shown. (B, C, D) MRC5 V1 cells were co-transfected with pT-Rex-DEST30 containing FLAG-RAD52 (Wt)-HA and either control or ATM-specific siRNA, as described in the Supporting Materials and Methods. Cell extracts were prepared 24 h after transfection. (B) Cell extracts were subjected to immunoblotting analyses with the indicated antibodies. (C, D) Where indicated, the cells were treated with doxorubicin for 2 h before preparing the cell extracts. Immunoprecipitated FLAG-RAD52-HA proteins from the cell extracts were subjected to immunoblotting analysis with the indicated antibodies. The relative band intensities normalized to those of the M5 bands (C) or to the HA bands (D) are shown. (E, F) Recruitment of RAD52 to DSBs is dependent on ATM. (E) T-Rex-293 cells expressing FLAG-RAD52 (Wt)-HA were irradiated with γ-rays (8 Gy). The KU55933 solution or the same volume of DMSO was added to the cells 1 h before irradiation. At 1 h after irradiation, the cells were subjected to immunofluorescent staining. Immunofluorescent images with anti-HA (green), anti-γH2AX (red), and anti-acetylated RAD52 at K323 (blue or white) antibodies. (F) The percentages of γH2AX foci colocalized with RAD52 in Fig 11E were calculated, as described in the Supporting Materials and Methods, and are shown in the graph. The numbers of protein foci per cell are also shown in the graph. Error bars indicate the standard error of the mean. Asterisks indicate statistically significant differences between the indicated pairs of groups (***, p<0.001 by t-test).

