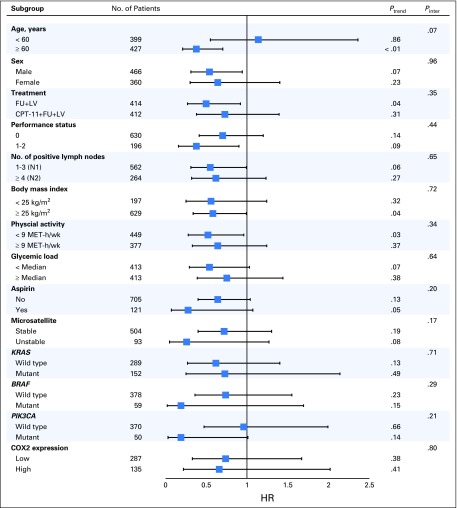
Fig 2.
Multivariable hazard ratios (HRs) and 95% CIs for cancer recurrence or mortality across strata of various factors. The analyses used five categories of total nut intake (never, less than one serving per month, one to three servings per month, one serving per week, and two or more servings per week). The forest plot represents the HRs of the comparison of never nut consumers versus consumers of two or more servings of nuts per week, adjusting for calorie intake, age, sex, depth of invasion through bowel wall, number of positive lymph nodes, baseline performance status, treatment group, body mass index, physical activity, aspirin use, and glycemic load. P values are two-sided; Pinter indicates P for interaction between strata and nut intake; Ptrend indicates P for trend across levels of nut intake. COX2, cyclooxygenase-2; CPT-11, irinotecan; FU, fluorouracil; LV, leucovorin; MET-h/wk, metabolic equivalent task hours per week.

