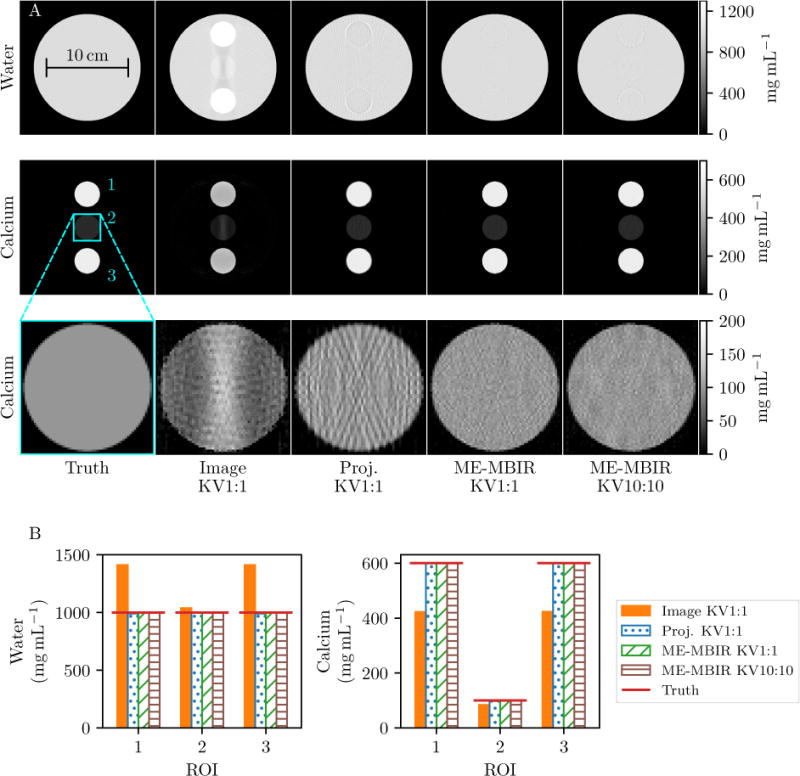
Figure 1.

Simulation study results. A: Reconstructions. The insert ROIS are numbered from top to bottom. The standard deviations of the calcium concentrations in insert 1 are 10.60 mg mL−1 for the image domain decomposition, 12.41 mg mL−1 for the projection domain decomposition, 8.11 mg mL−1 for MBMD KV1:1, and 8.71 mg mL−1 for MBMD KV10:10. B: Average concentration in each insert for water (left) and calcium (right).
