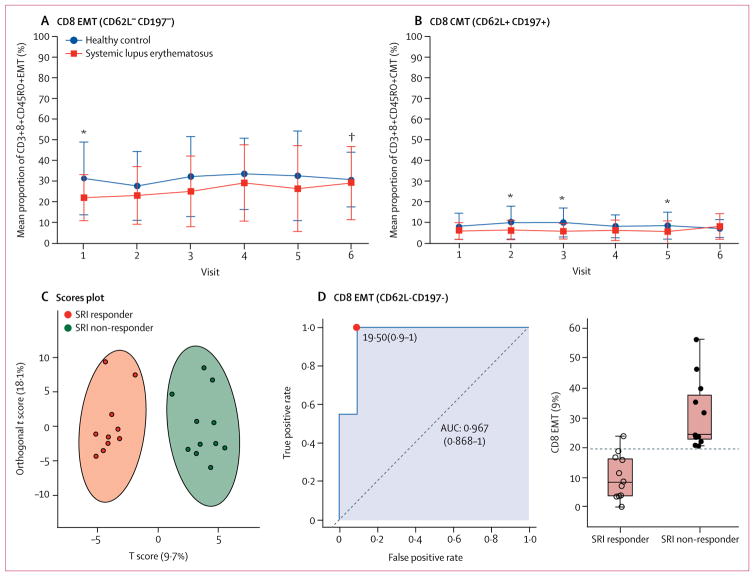
Figure 5. Changes in CD8 EMT and CMT cells.
Changes in CD8+ CD62L−CD197−EMT cells (A) and CD8+CD62L+CD197+ CMT cells (B) during sirolimus treatment, compared with healthy controls. Changes in CD8 EMT and CMT cells were assessed by two-tailed unpaired t test relative to matched healthy controls and by two-tailed paired t tests relative to visit 1 in each patient. Error bars show SD. (C) Orthogonal partial least squares discriminant analysis of 22 patients, for whom a complete dataset was available, shows discrimination of SRI responsive and SRI non-responsive patients by two components of immunobiological biomarkers, using complete biomarker datasets. (D) Discrimination of SRI responsive and SRI non-responsive patients on the basis of the AUC logistic regression approach. The left panel shows the AUC CI, true positive and false positive rates, and CI. The right panel shows the abundance of EMT cells in SRI responsive and SRI non-responsive patients. Black horizontal lines indicate mean values in each patient group. Vertical lines indicate range. The horizontal dotted line shows the optimum cutoff between responsive and non-responsive patients. EMT=effector memory T. CMT=central memory T. SRI=systemic lupus erythematosus responder index. AUC=area under the receiver operating characteristic curve. *p<0·05 relative to matched healthy controls. †p<0·05 relative to visit 1 in each patient.

