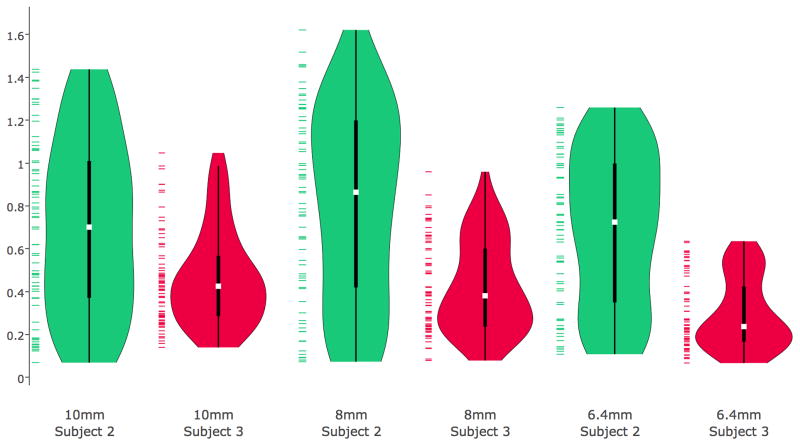
Figure 3.
Distribution of RMS error displacement on two different subjects with large rotations at three vNav resolutions. Each violin represents results from 420 pairs of registration with rotations ranging from 5 to 25 degrees and translation from 1 to 5 mm. Median value is shown as a white point in each violin, and on the left side of each violin is the scatter plot of the values of RMS error.

