Figure 4.

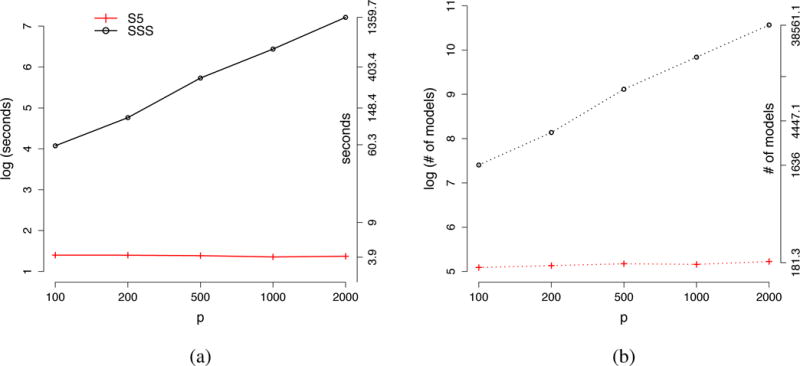
(a) the average computation time to first hit the MAP model; (b) the average number of models searched before hitting the MAP model. The left y-axis is in a logarithmic scale and the right y-axis is in the raw scale.

(a) the average computation time to first hit the MAP model; (b) the average number of models searched before hitting the MAP model. The left y-axis is in a logarithmic scale and the right y-axis is in the raw scale.